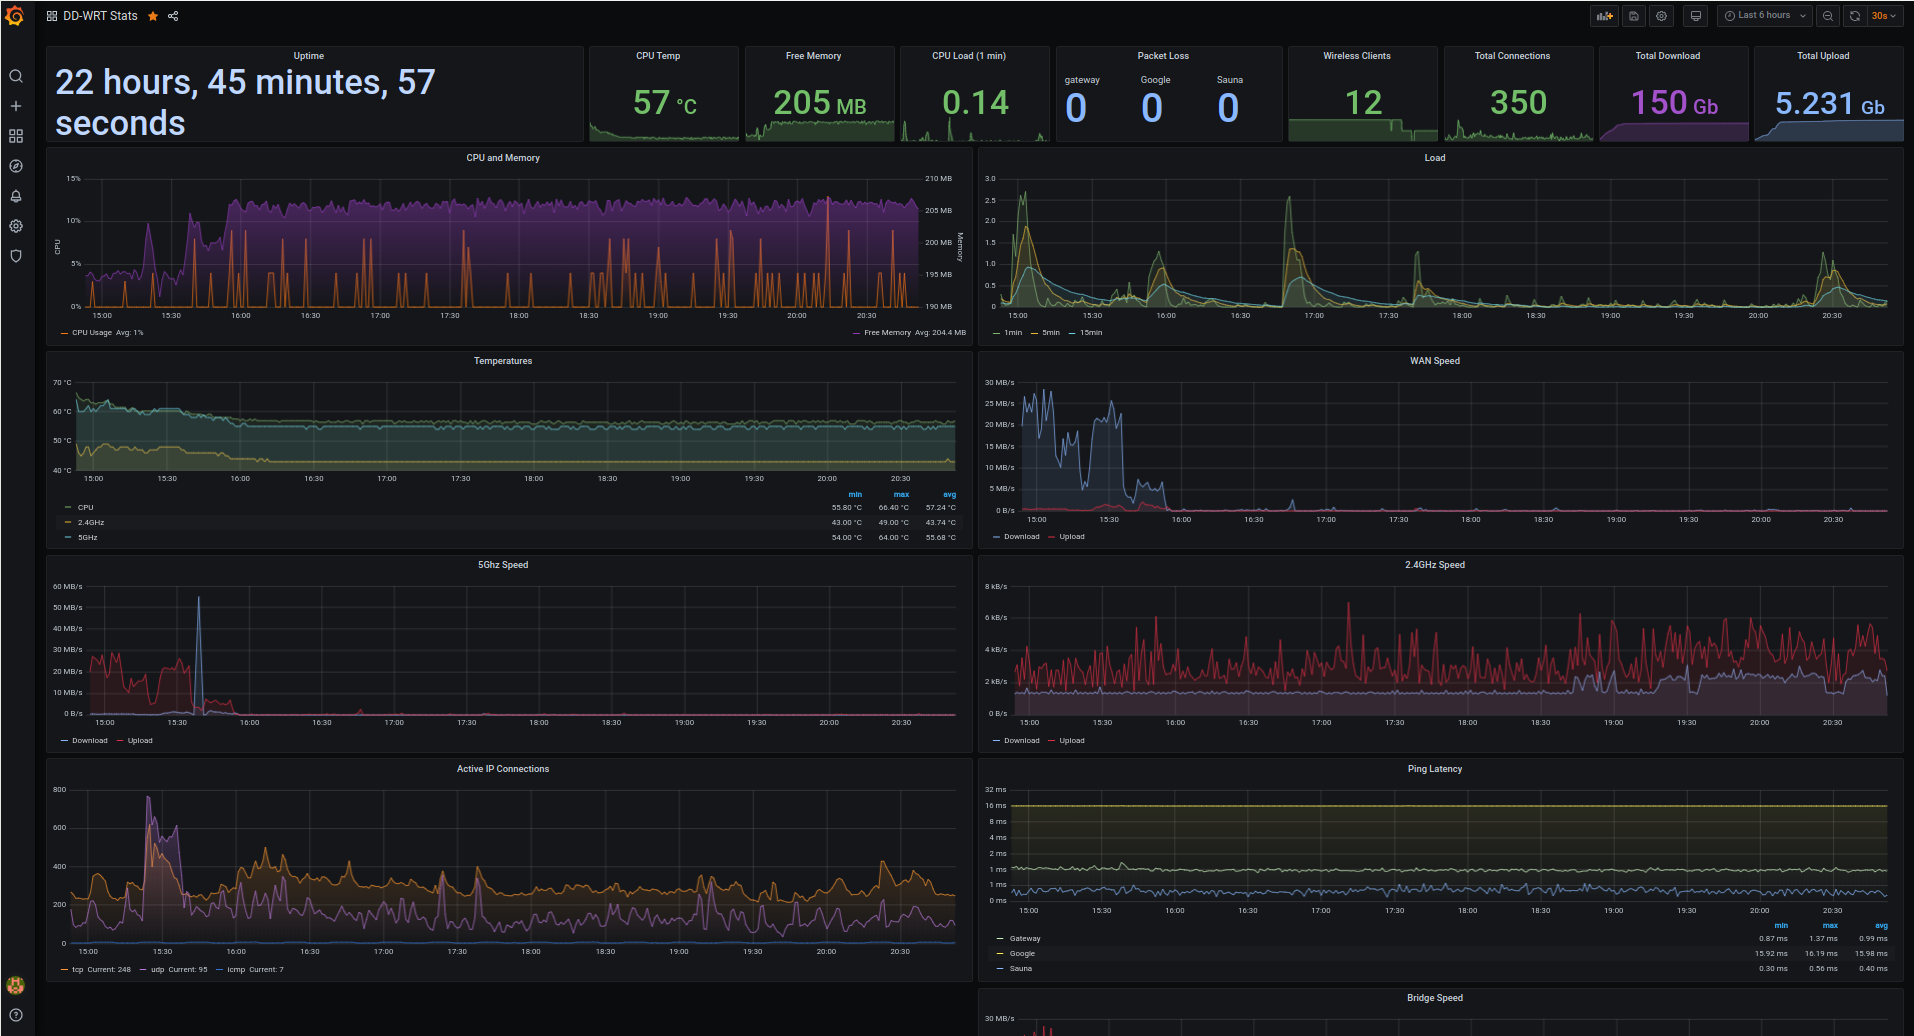
Export of router stats to InfluxDB, and presentation with Grafana JSON Model
- A router running DD-WRT
- A local server running InfluxDB and Grafana.
- Enable JFFS support on the router
- Upload the script to /jffs/bin/
- Edit the database IP, and port.
- Add
* 0 * * * root /jffs/bin/main.sh > /dev/null 2>&1to router cron jobs. - Import JSON file to grafana.
This is working and tested on a Netgear R7000 Based / modified of https://github.com/trevorndodds/dd-wrt-grafana
