Run tests against specified URL's to keep control of your browser based experience .
Set a performance budget and run, whenever you want..
Measuring website performance is hard work, and Auto perf budget helps you profile your web site using a headless chrome browser to help you keep track of the answers to questions like this:
As a developer I want to know if my webpage is takes more than X ms to be interactive
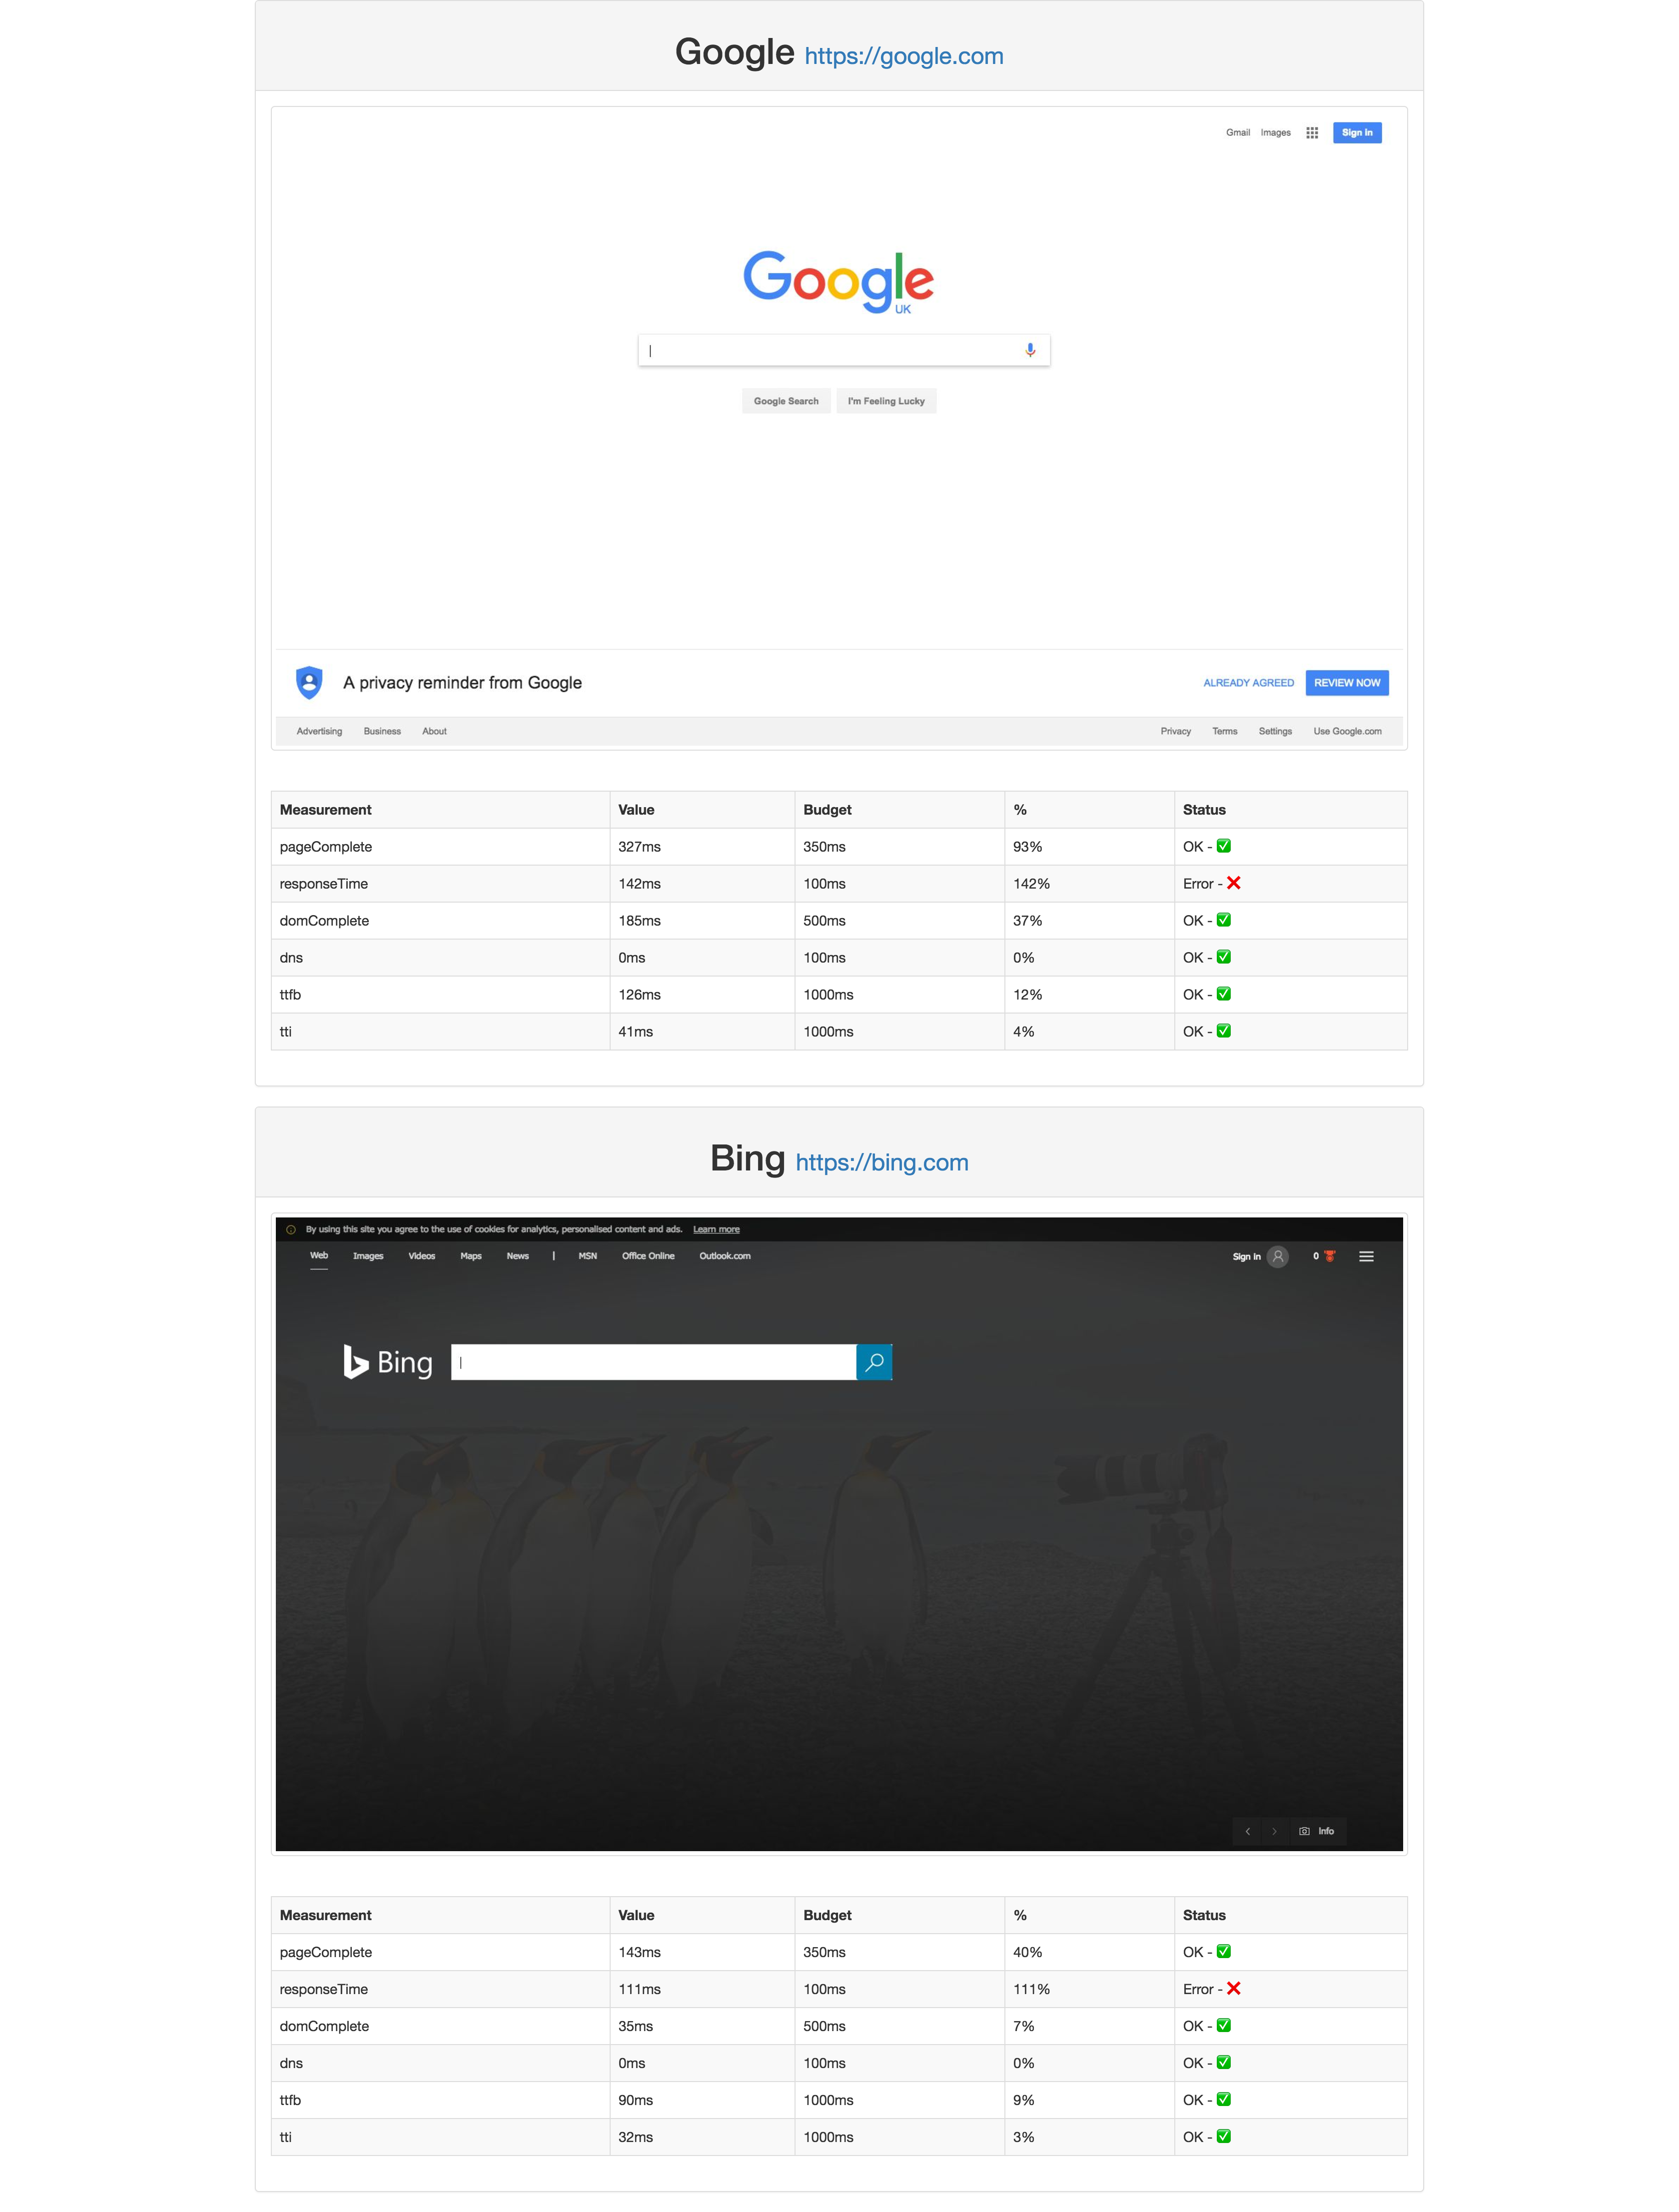
Auto perf budget can be run locally, generating HTML reports or as command line interface for adding to build pipelines or as pre/post release step.
Auto perf budget opens specified URL's and checks against your defined performance budget values. It will report an error if your website is performing incorrectly.
Run the app using this command:
auto-perf-budget --config test.config.js--config <config-location>See example (test.config.js):
module.exports = {
  urls: [
    {
      id: 'crc',
      url: "https://chainreactioncycles.com",
      screenshots: screenshots(),
      viewport: viewport()
    },
    {
      id: 'ebay',
      url: "https://ebay.com",
      screenshots: screenshots(),
      viewport: viewport()
    }
  ],
  report: 'html',
  budget: {
    level: 'error',
    timeline: {
      pageComplete: 350,//ms
      responseTime: 100,//ms
      domComplete: 500,//ms
      dns: 100,
      ttfb: 1000,//ms
      tti: 1000//ms
    }
  }
}const screenshots = filename => ({
enabled: true,
fullPage: false,
type: 'jpeg',
quality: 80
}); Specify screenshot settings for each URL in config. Extends the default values found in Chrome puppeteer see screenshot here
const viewport = () => ({
  width: 1600,
  height: 2500,
  deviceScaleFactor: 1,
  isMobile: false,
  hasTouch: false,
  isLandscape: true
});
Specify the viewport settings for each URL in config. Extends the default values found in Chrome puppeteer see viewport here
report: 'html' || 'cli' Html: will open a html file with a report of each page and it's results.
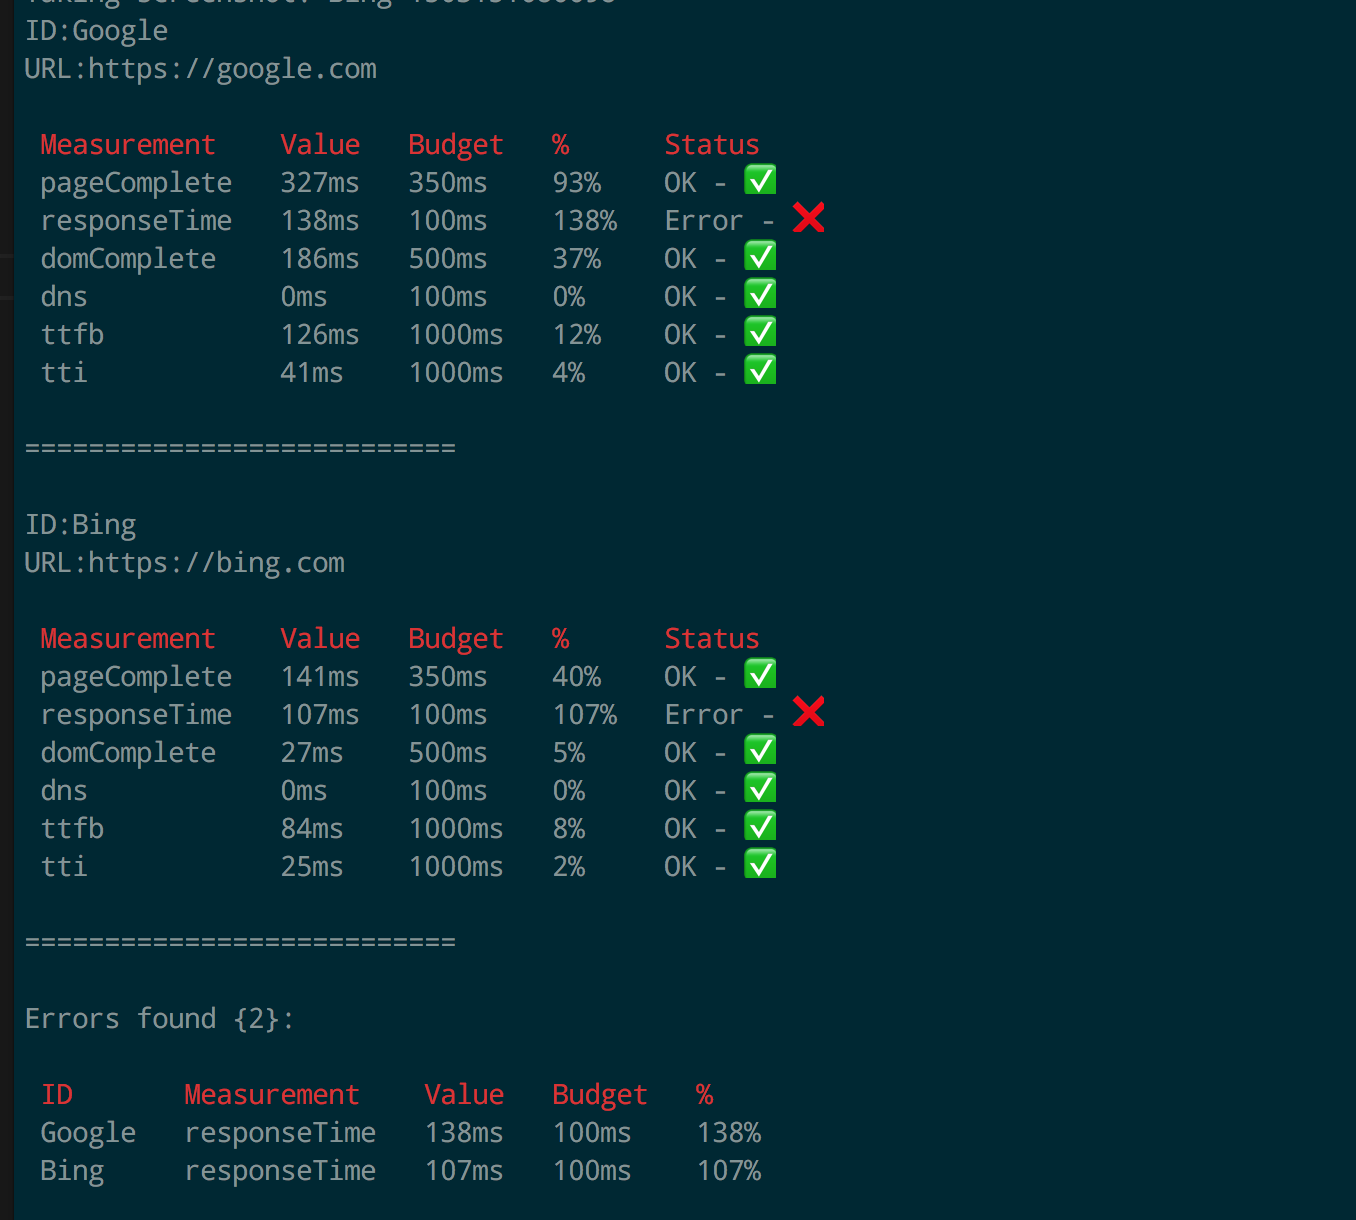
Cli: will show the results in the command line, an error will throw an exit code.
Uses the window.performance information, configure this object to set the values you want to benchmark against:
  timeline: {
    pageComplete: 350, //ms
    responseTime: 100, //ms
    domComplete: 500, //ms
    dns: 100, //ms
    ttfb: 1000, //ms
    tti: 1000 //ms
  }
Potential use-cases:
- Automating screenshots of website;
- Automate checking speed of website;
- Cache warming of multiple pages;
- Run after release and check recent changes aren't working against you.
- Add to build pipeline on CI and check test envs.
Loads more.......
Below is an example of output from cli:
@TODO Future Features:
- Measuring resources on page and setting limits per asset.
- Checking for more common performance bottlenecks, redirects, blocking scripts etc.
Uses Chrome puppeteer under the hood.
MIT License
Copyright (c) [2017] [Daniel Jenkins]
Permission is hereby granted, free of charge, to any person obtaining a copy of this software and associated documentation files (the "Software"), to deal in the Software without restriction, including without limitation the rights to use, copy, modify, merge, publish, distribute, sublicense, and/or sell copies of the Software, and to permit persons to whom the Software is furnished to do so, subject to the following conditions:
The above copyright notice and this permission notice shall be included in all copies or substantial portions of the Software.
THE SOFTWARE IS PROVIDED "AS IS", WITHOUT WARRANTY OF ANY KIND, EXPRESS OR IMPLIED, INCLUDING BUT NOT LIMITED TO THE WARRANTIES OF MERCHANTABILITY, FITNESS FOR A PARTICULAR PURPOSE AND NONINFRINGEMENT. IN NO EVENT SHALL THE AUTHORS OR COPYRIGHT HOLDERS BE LIABLE FOR ANY CLAIM, DAMAGES OR OTHER LIABILITY, WHETHER IN AN ACTION OF CONTRACT, TORT OR OTHERWISE, ARISING FROM, OUT OF OR IN CONNECTION WITH THE SOFTWARE OR THE USE OR OTHER DEALINGS IN THE SOFTWARE.


