Work in progress, Oct 22, 2024
This repo contains a set of tools for the analysis of retinal fundus autofluorescence images. So far it has been usd in "Quantifying the progression of Stargardt disease ... etc" by Mihalek at al, submitted for publication.
If you would like to help fixing and building on this code, please report any issues in the issue tracker of this repo, or create a branch and make a pull request.
python3 -m venv venv
. venv/bin/activate
pip install -r requirements.txt
For a simple tryout using sqlite, you can comment out the psycopg2 or mysqldb lines from requirements.txt.
This brief into assumes that you can find your way around python - using virtual environment, installing missing packages, and running scripts from the command line or from within your favorite IDE.
The csv/tsc should have the following columns, in arbitrary order: "patient alias", "image path", "eye". It also may contain the columns names "haplotype tested", "is control", "onset age", "age acquired", "height", "width", "disc x", "disc y", "fovea x", and "fovea y".
Note that you can export a table in csv format from any major spreadsheet application.
Here is an example input table (note: the patient data is invented, for the purposes of this demo):
| patient alias | haplotype tested | is control | onset age | eye | age acquired | image path | width | height | disc x | disc y | fovea x | fovea y |
| 130508 | n | n | 20 | OD | 40 | /home/ivana/projects/ABCA4/images/asrs-rib-image-130508.jpg | 3968 | 3968 | 2640 | 1958 | 1974 | 1941 |
| 130509 | n | n | 20 | OS | 40 | /home/ivana/projects/ABCA4/images/asrs-rib-image-130509.jpg | 3916 | 3916 | 1490 | 2029 | 2106 | 2024 |
| 71476 | n | n | 6 | OD | 18 | /home/ivana/projects/ABCA4/images/asrs-rib-image-71476.jpg | 935 | 619 | 476 | 333 | 565 | 363 |
To use averaging over the left and the right eye, please provide, additionally, a table that specifies which images correspond to the eye pair of the same person and taken during the same visit.
| left eye | right eye |
| /home/ivana/projects/ABCA4-faf/images/asrs-rib-image-130509.jpg | /home/ivana/projects/ABCA4-faf/images/asrs-rib-image-130508.jpg |
Here is a possible sample input. Note that you will have to create a (free) account with Retina Image Bank to download the images
- https://imagebank.asrs.org/file/71476/stargardt-disease
- https://imagebank.asrs.org/file/130508/stargardt-disease
- https://imagebank.asrs.org/file/130509/stargardt-disease
For demo purposes, please provide the image dimensions andn This can be done, foe example, by opening a FAF image uing GIMP (a public-domain image manipulation program), placing the cursor over your best guess for the fovea or disc centers, and reading off the coordinates in the lower left corner.
This code uses Peewee ORM,
and was tested to work with MySQL, postgres, and SQLite. The easiest way to start is with
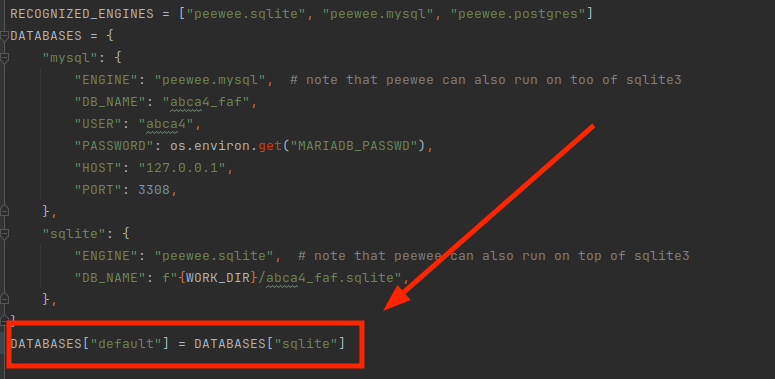
SQLite, in which case you do not have to do anything except making sure that SQLite si selected
in faf00_settings.py file. See below.
Fill in the values in faf00_settings.py.
In particular, you will need a work directory where
scripts can store auxiliary files, if needed. It should be specified as
WORK_DIR variable in the faf00_settings.py file.
The auxilary files will be stored in a directory subtree in WORKDIR, grouped by the
patient alias, for example
├── Patient1
│├── auto_bg_histograms
│├── auto_bgs
│├── bg_histograms
│├── composites
│├── elliptic_masks
│├── outer_masks
│├── overlays
│├── recals
│├── roi_histograms
│└── vasculatures
├── Patient2
│├── auto_bg_histograms
│├── auto_bgs
│├── bg_histograms
│├── composites
│├── elliptic_masks
│├── outer_masks
│├── overlays
│├── recals
│├── roi_histograms
│└── vasculatures
├── reports
│├── auto_bg_histogram.pdf
│├── bg_histogram.pdf
│├── lu45667o8s5n.tmp
│└── overlay.pdf
.
.
.If faf01_settings_sanity_check.py is not executable, make it so (not needed if you
are using and IDE), and run.
You don't have to run this script, but if you do it will
do some basic sanity checking for the settings you have provided.
If it complains about the sqlite database missing, run faf02_db_tables.py first and then
return to this step.
Run faf02_db_tables.py. It will create a database with empty tables to be filled the
image info. The scripts downstream will use the information you provided there, and also
store their own results therein.
If you use tab as the field separator, please give the file the extension ".tsv" because the separator is guessed from the extension (',' for a csv, and '\t' for tsv file.)
Then use the infomration tables you have created to fill the database:
./faf0301_load_image_info.py images/images.tsv
./faf0303_load_image_pair_info.py images/image_pairs.tsv To do some further sanity checking on the images - such as that the files actually exist, and the fovea and disc centers are inside the image bounds, do
./faf05_img_sanity_checks.py./faf06_disc_macula_ellipse_overlay.py faf06_disc_macula_ellipse_overlay.py creates a transparent background overlay image
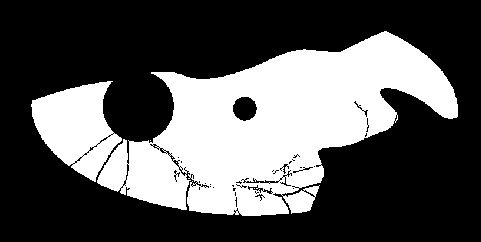
to be used in manual steps and sanity checking downstream. Overlayas are simple transparent
images that should ook like this:
Note the inner and outerellipses, centered on the fovea, and dimensions specified in faf00_settings.py:
# geometry parameters used in fundus analysis
# the unit distance is the distance between the centers of optic disc and fovea
GEOMETRY = {
    "disc_radius": 1 / 3,
    "fovea_radius": 1 / 9,
    "ellipse_radii": (2, 1),
    "outer_ellipse_radii": (3, 2),
    "cropping_radii": (3, 2),
}If the images challenging because of the presence of the artifacts, the artifact-free ('usable') region and the background intensity distribution sampling region might have to be determined manually. See manual_labeling.
In high-quality images, the background intensity distribution sampling region can be determined automatically. See auto_labelling.
As of this writing (late Aug, 2024) we have no way of automatically detecting artifacts in FAF images, so the analysis pipeline starts with manually delineating the region within eyelashes, shadows, hair, etc. If the inner ellipse is within this region, we take it as a signal that the image is of reasonable quality, and an automatic way of detecting a background sampling region can be attempted. Otherwise, we resort to manually delineating the background sampling region.
Note, however, that automatic selection of the bg region might still be impossible, because the hypoflurescent region has already covered most of the outer ellipse, where we suggest the bg sampling region should be placed
Use faf10_automatable/faf1001_find_clean_view_imgs.py. The images in which the inner ellipse is partly covered by the artifacts will set to False the boolean field 'celan_view' in the 'faf_images' table in the database.
See faf09_manual_preproc/manual_labeliing.md
Use faf10_automatable/faf1002_auto_bg_regions.py.
To restrict your analysis to the images with the clean view of the ROI (the inner ellipse) pass the
-v/--clean_vew_only flag to the script.
Note that we use the recalibrated images only for the purpose of blood vessel detection. Empirically, the blood vessel detection works better on recalibrated images, while we prefer to leave the images un-manipulated for the scoring purpose.
Collect background histogram data using faf12_background_hists.py This script will fall back on manually delineated background regions if the auto bgs are not available.
To create recalibrated images in the WORKDIR specified in faf00_settings.py, run
faf13_img_recalibration.py. -h to see the options.
Blood vessel detection is currently a simple heuristic using traditional image processing tools from Piillow and scikit-image: faf15_blood_vessel_detection.py. The heuristic is rather fragile, and will likely be replaced in the future.
./faf13_blood_vessel_detection.py
./faf17_mask_creation.py
./faf17_mask_creation.py -l
In all commands
-h|--helpflag to print out the help message-x|--skip_xistingwill skip re-creating the overlay / blood vessel / mask image if one is already found in the work directory.-p|--pdfwill create a pdf file in theWORKIDR/reportsdirectory for quick manual inspection of the images created
A note about the parallelization: these script also take -n|--n-cpus option, however, due to
an oversight in the current implementation (Aug 2024) it does not work in the cases where sqlite is used
as a storage.
faf13_blood_vessel_detection.py uses combination of traditional image processing methods
to detect the outline of the blood vessels in each of the input images. It may fail in the cases
of low contrast images, such as srs-rib-image-130508.jpg here, or in the cases of advanced Stargardt disease,
when the large hypofluorescent areas start obscuring the vasculature.
faf17_mask_creation.py will create ROI mask, like this one, for example

(this is a rather extreme example where a good chunk of the fundus view was obscured by eyelids / eyelashes.)
faf17_mask_creation.py -l will create a larger mask, to be used in deciding where to take a sample
that represents the background distribution of intensities.
faf18_image_region_composites.py This step is optional, but advisable - create (for manual inspection) composite images consisting of the original image, with the elliptical ROI, fove and optic head, usable and bg sampling regions overlaid:
They should wind up in the work directory (refer to the work directory tree above), and look something like this:
Note that the -p flag is needed to produce the pdf version of the report.
Alternatively, -s can be used to produce pptx files,
though these tend to be rather voluminous.
Run
faf22_roi_histograms.py -cfollowed by
faf22_roi_histograms.py -c -land finally
23_gradient_correction.pyThis number should be used as a correction for using
the reference region in the outer ellipse, by setting
SCORE_PARAMS["gradient_correction"] in faf00_settings.py to that number.
SCORE_PARAMS = {
    "black_pixel_weight": 10,
    "gradient_correction": myvalue_here
}Caveat: if the control images are not of the same quality as the clinical images analyzed (and / or obtained under very similar conditions), this does not really help.
THis is a strictly optional step, used for producing an illustration in the original paper faf25_hist_progression.py
The output should look like
And, finally, we get to score the FAF images in our set
faf28_pixel_score.py
faf3000_score_vs_time_plot.py
faf3002_score_sensitivity_to_fovea_location.py  # note this one takes very long
faf3005_score_od_vs_os_plot.py
faf3006_score_comparison.pyfaf3008_hist_progression.py faf3010_image_region_composites.py One illustration should look like this (without the blue square in the center):
amd the script can create a 'catalogue' of such images in pdf format whn used with -p option.
Works for manually selected background regions only.
./faf3012_dataset_overview.pyThe output should look something like
    We included images from 21 visits.
    A total of 1-12 images (median 2)
    spanning 0.0-6.4 (median 0.0) were obtained in each patient. The first of these was obtained
    at a median age of 10.3 years (range 5.2–19.4).
The median interval between follow-up visits was 2.0 (range 0.3–6.4). Note: the following script expects that faf12_background_hists.py
and faf22_roi_histograms.py
were run for all cases (just run with the default options,
wihtout -c option that limits the run to controls).
It also expects the images produced by running faf28_pixel_score.py with -p option.
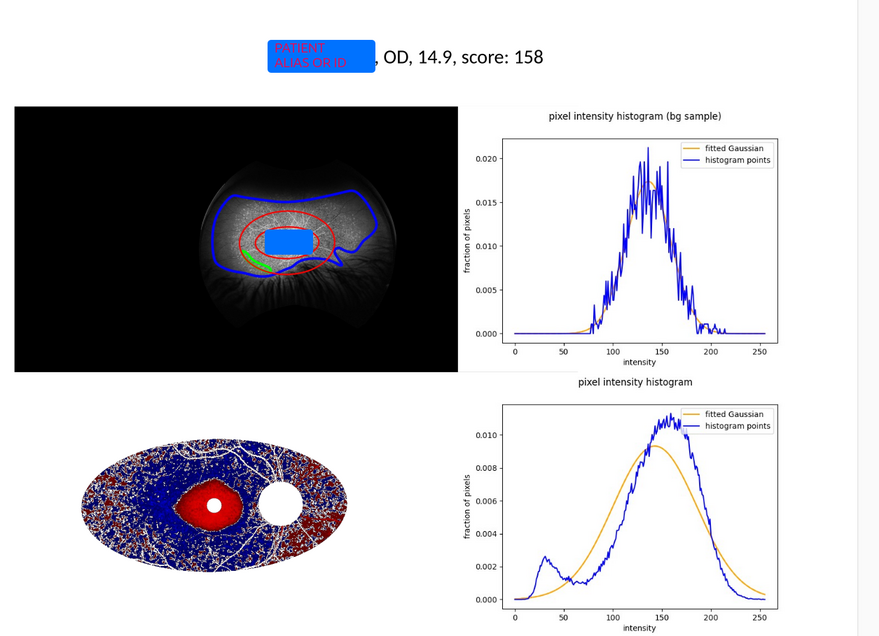
./faf3016_case_catalog.pyThe output will be a catalog in pdf format, showing the illustration (heatmap) of the
pixel level scores and histograms collected in the ROI and the background regions, like this:

Similar to the above, except the images are shown as pairs, and the patient cases sorted by the increasing average score.
faf3018_score_catalog.pyVisualisation of the idea behind the heuristic score used here.
faf5000_score_simulation.py

