npm install hilbert-curveNode / module bundlers
const hilbertCurve = require("hilbert-curve");

// or

import * as hilbertCurve from "hilbert-curve";
Browser:
<!-- unpkg -->
<script src="https://unpkg.com/hilbert-curve"></script>

<!-- jsdelivr -->
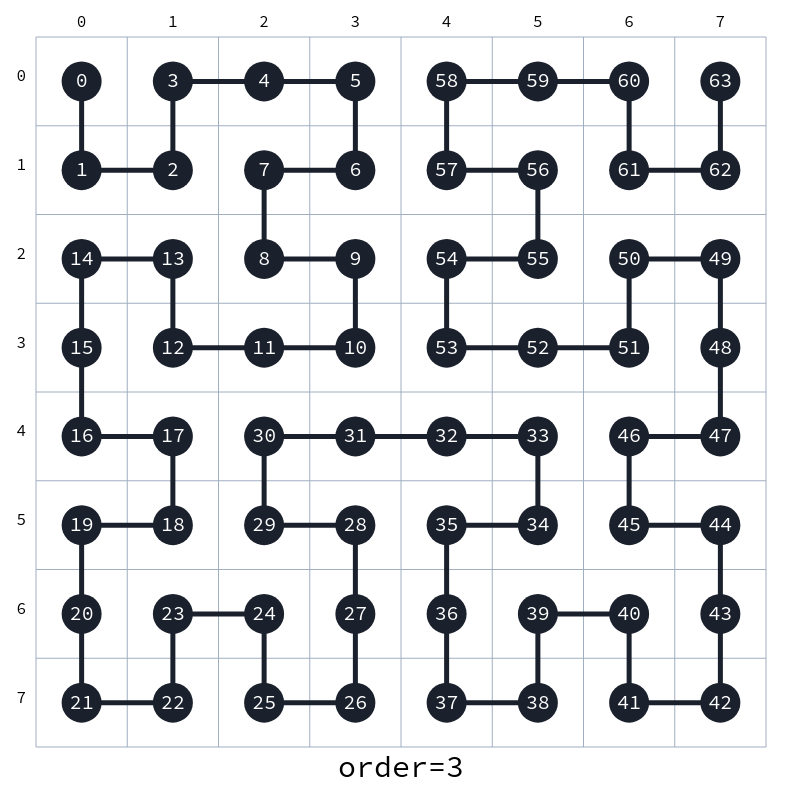
<script src="https://cdn.jsdelivr.net/npm/hilbert-curve"></script>Given an index index, return the point on the Hilbert curve of order order
(the length of the entire curve being 2^order * 2^order), e.g.
// order is 3, i.e. curve is defined on a 2^3 * 2^3 = 8 * 8 square
hilbertCurve.indexToPoint(17, 3);
// { x: 1, y: 4 }Inverse: given a point {x,y} on the Hilbert curve of order order, return the index, e.g.
hilbertCurve.pointToIndex({ x: 5, y: 2 }, 3);
// 55Construct the Hilbert curve of data, and optionally specify its order.
data has to be an array or an object that can be converted to an
array using
Array.from().
If no order is given, a curve of order
Math.ceil(Math.log2(Math.sqrt(data.length))) is constructed.
Note, that if Math.sqrt(data.length) is not a power of 2,
the curve will contain empty/undefined items.
If an order is given that is smaller than Math.ceil(Math.log2(Math.sqrt(data.length))),
the values of data will first be binned using
@mhyfritz/bin-data. By
default, numeric data is assumed and the maximum value is picked for every chunk, however,
a function pickRepresentative can be passed as a third argument to construct.
For more details on this, confer the docs of
@mhyfritz/bin-data.
Example:
// data is `[1, 2, 3, ..., 14, 15, 16]`
const data = Array.from({ length: 4 * 4 }, (_, i) => i + 1);
hilbertCurve.construct(data, 2);
// [1, 2, 15, 16, 4, 3, 14, 13, 5, 8, 9, 12, 6, 7, 10, 11]
// to be interpreted as 4x4 square:
//  1  2 15 16
//  4  3 14 13
//  5  8  9 12
//  6  7 10 11