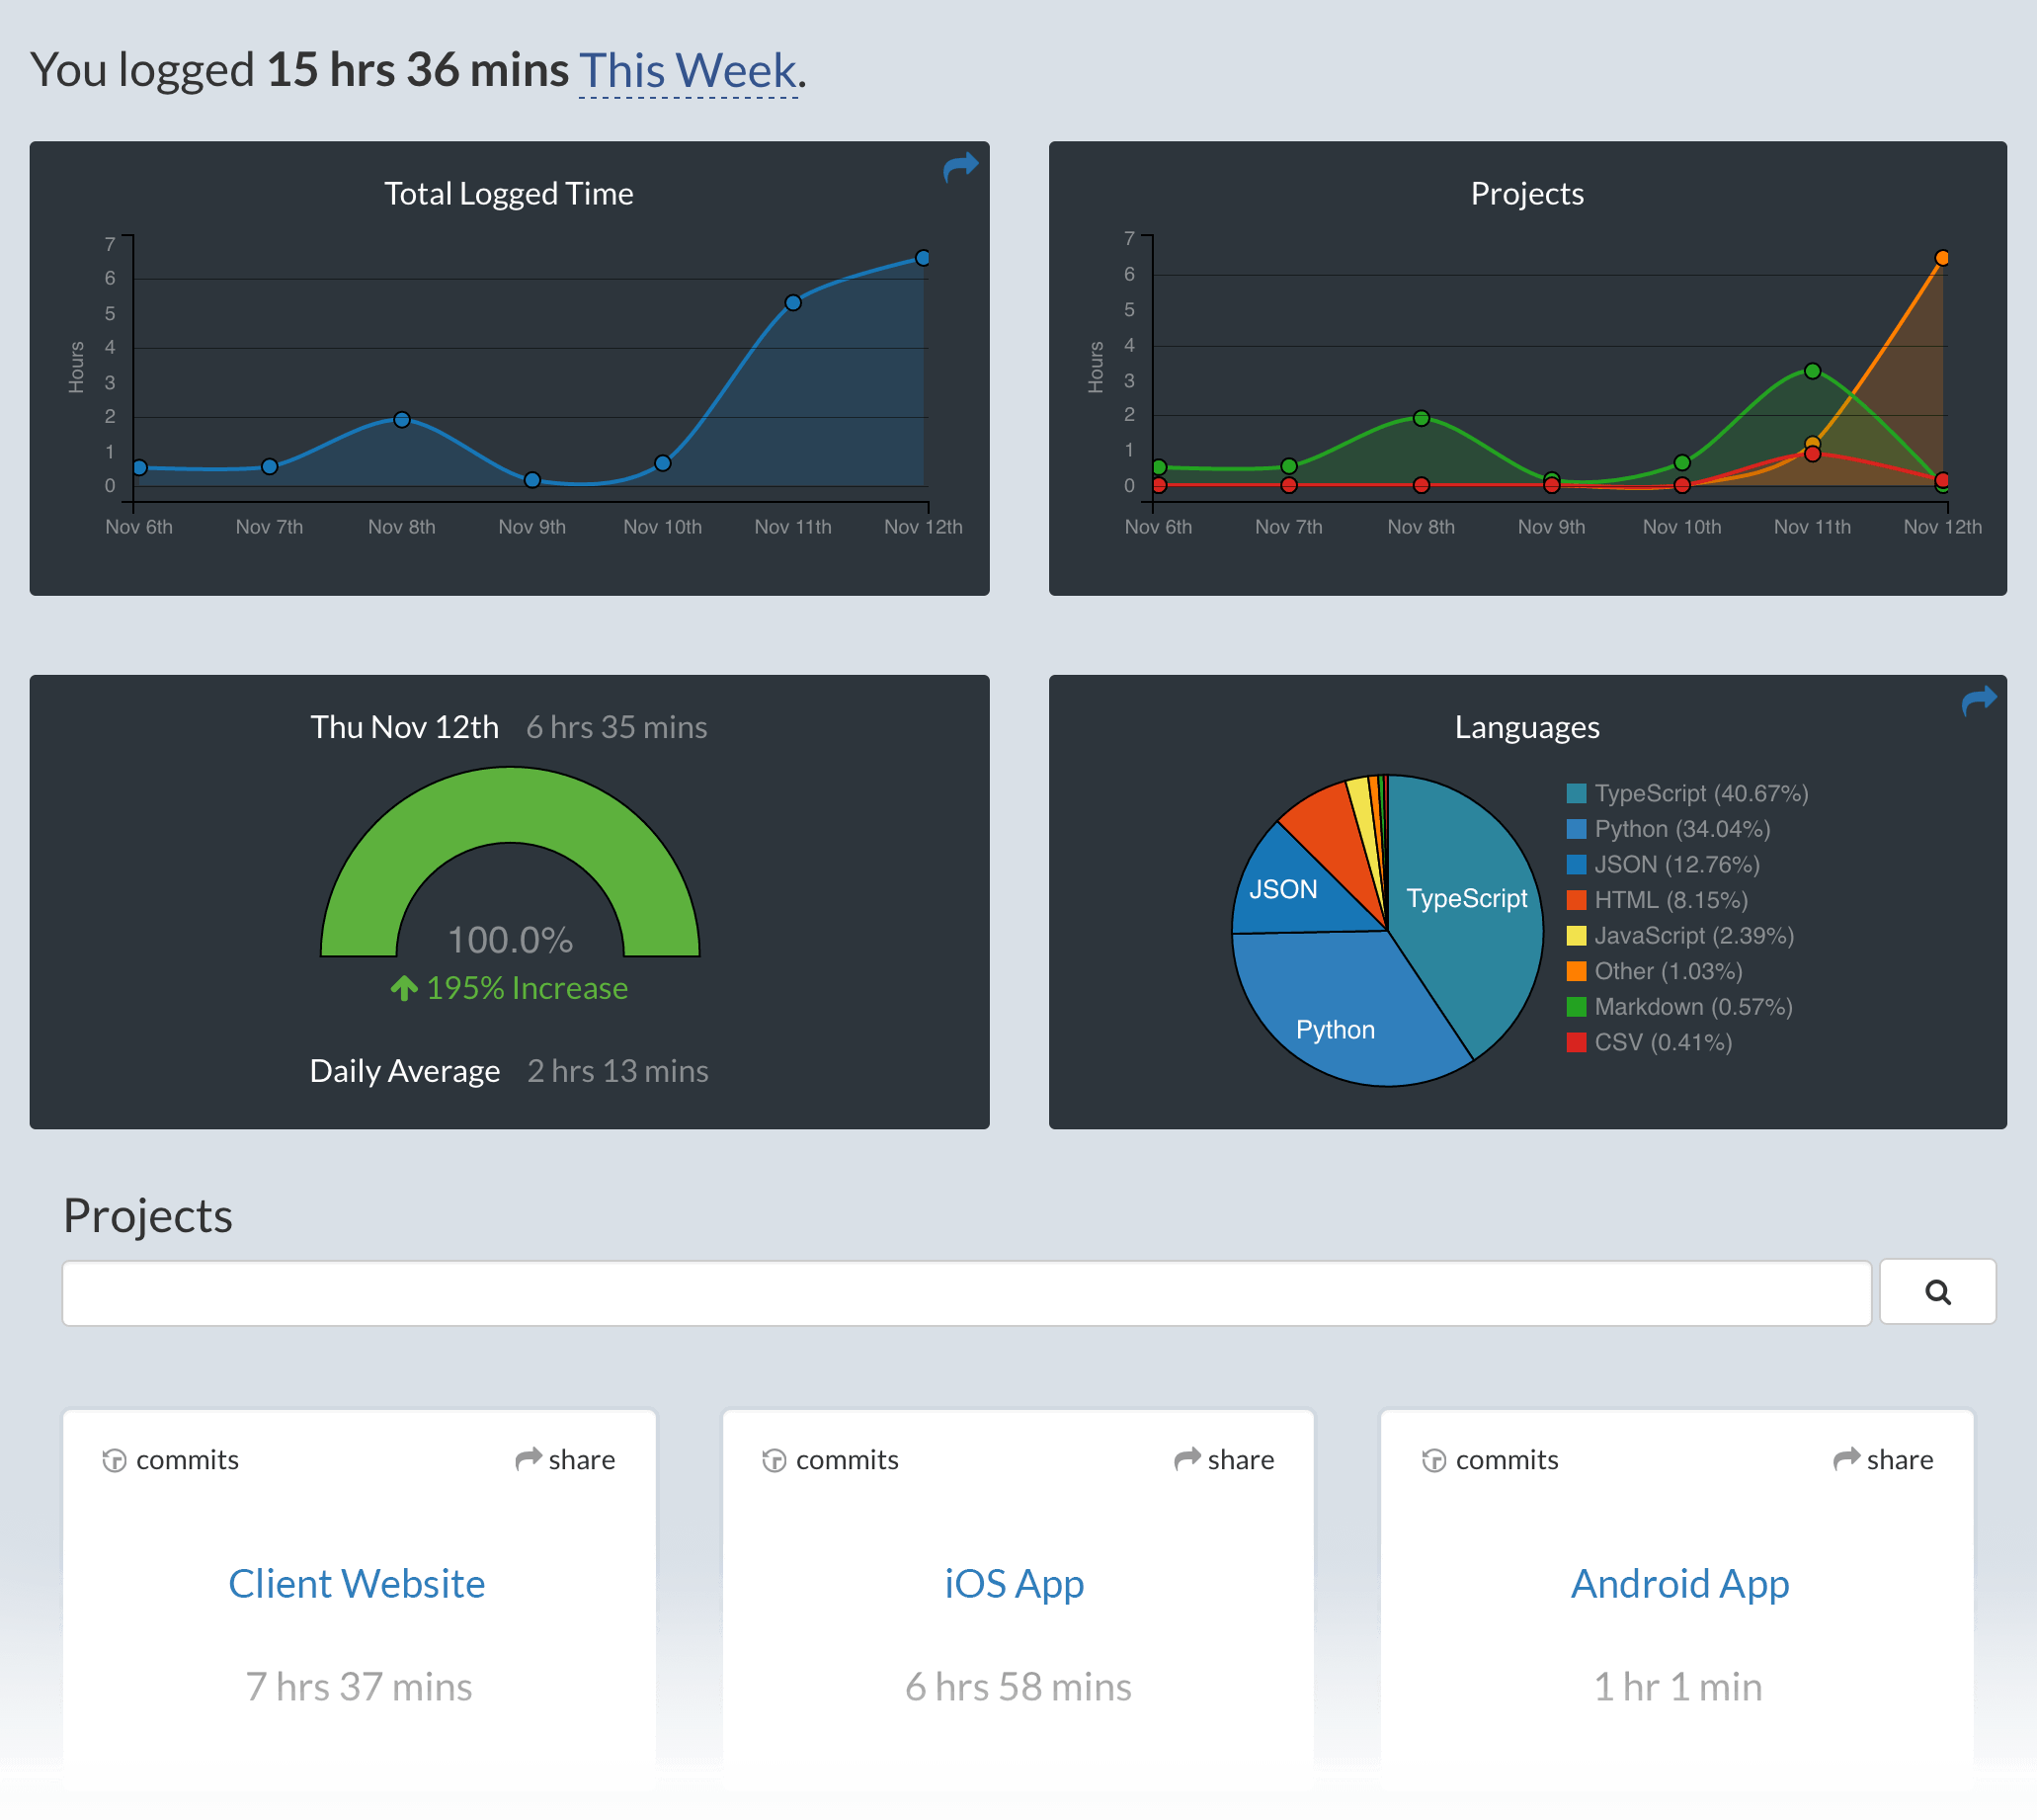
Metrics, insights, and time tracking automatically generated from your programming activity.
- Press
F1orCMD + Shift + Pand typeinstall. PickExtensions: Install Extension.
- Type
wakatimeand hitenter.
-
Restart Visual Studio Code.
-
Enter your api key, then press
enter.
(If you already have a WakaTime plugin installed, you won't be prompted for your api key.)
- Use VSCode and your coding activity will be displayed on your WakaTime dashboard.
Visit https://wakatime.com to see your coding activity.
Some settings are available from CMD+SHIFT+p, then typing wakatime.
Settings are stored in the INI file at $HOME/.wakatime.cfg.
More information can be found from wakatime core.
First, turn on debug mode:
- Press CMD+SHIFT+p
- Type
wakatime.debug, and pressEnter. - Select
true, then pressEnter.
Next, open your Developer Console to view logs and errors:
Help → Toggle Developer Tools
Errors outside the scope of vscode-wakatime go to ~/.wakatime.log from wakatime-cli.
The How to Debug Plugins guide shows how to check when coding activity was last received from your editor using the User Agents API. For more general troubleshooting info, see the wakatime-cli Troubleshooting Section.


