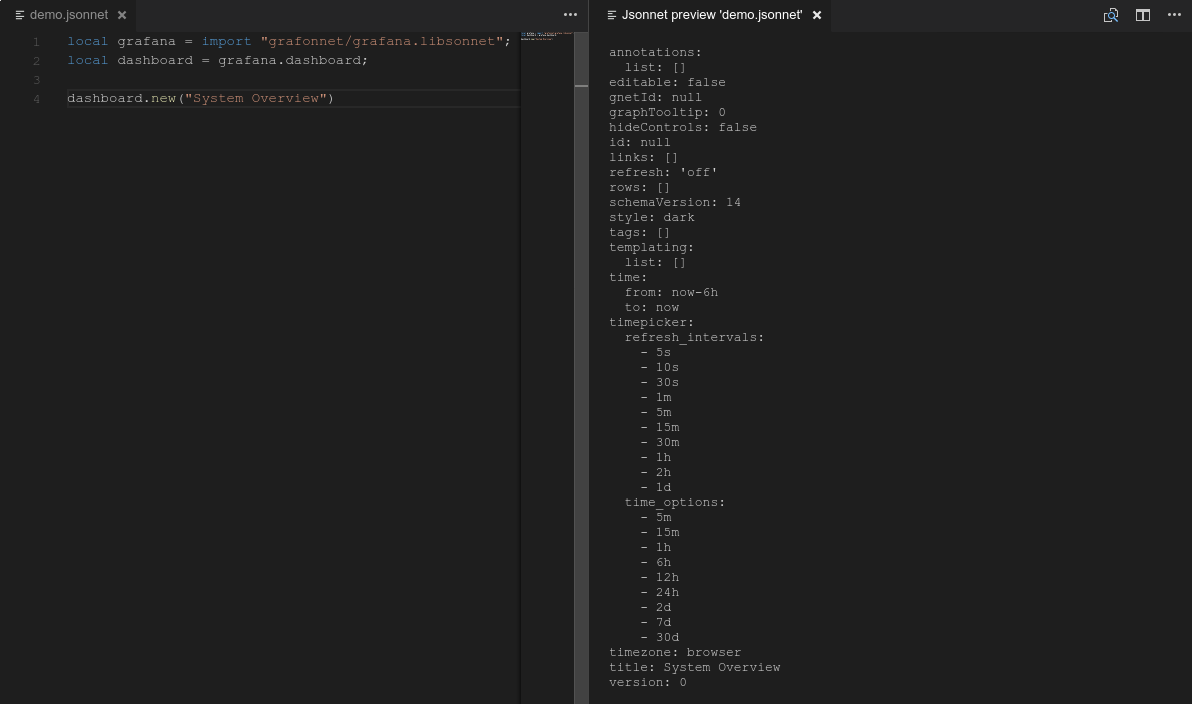
Grafonnet provides a simple way of writing Grafana dashboards. It leverages the data templating language Jsonnet. It enables you to write reusable components that you can use and reuse for multiple dashboards.
Grafonnet requires Jsonnet.
You must build the binary. For details, see the GitHub repository.
Jsonnet is available in Homebrew. If you do not have Homebrew installed, install it.
Then run:
brew install jsonnet
Clone this git repository:
git clone [email protected]:grafana/grafonnet-lib.git
Then import the grafonnet in your jsonnet code:
local grafana = import "grafonnet/grafana.libsonnet";
To be able to find the grafonnet library, you must pass the root of the git
repository to grafonnet using the -J option:
jsonnet -J <path> dashboard.jsonnet
As you build your own mixins/dashboards, you should add additional -J paths.
Simple dashboard:
local grafana = import "grafonnet/grafana.libsonnet";
local dashboard = grafana.dashboard;
local row = grafana.row;
local singlestat = grafana.singlestat;
local prometheus = grafana.prometheus;

dashboard.new(
    "JVM",
    tags=["java"],
)
.addRow(
    row.new(id=2)
    .addPanel(
        singlestat.new(
            "uptime",
            format="s",
            datasource="Prometheus",
            id=3,
            span=2,
            valueName="current",
        )
        .addTarget(
            prometheus.target(
                "time()-process_start_time_seconds{env=\"$env\",job=\"$job\",instance=\"$instance\"}",
            )
        )
    )
)
Find more examples in the examples directory.
