Dr. Mingw is a Just-in-Time (JIT) debugger. When the application throws an unhandled exception, Dr. Mingw attaches itself to the application and collects information about the exception, using the available debugging information.
Dr. Mingw can read debugging information in DWARF format — generated by the Gnu C/C++ Compiler, and in a PDB file — generated by the Microsoft Visual C++ Compiler. It relies upon the DbgHelp library to resolve symbols in modules compiled by the Microsoft tools.
The functionality to resolve symbols and dump stack backtraces is provided as DLLs so it can be embedded on your applications/tools.
You should download and install the 64 bits binaries for Windows 64 bits (and it will handle both 64 and 32 bits applications), or the 32 bits versions for Windows 32 bits.
To install enter
drmingw -i
Dr. Mingw will register itself as the JIT debugger by writing into the system registry. Make sure you have Administrator rights. See this page and this page for more information on how this works.
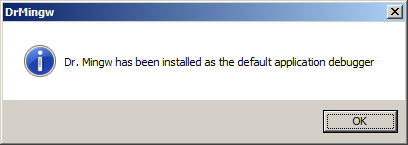
If the installation is successful, the following message box should appear:
To enable other options they must be set them along with the -i option. For example,
drmingw -i -v
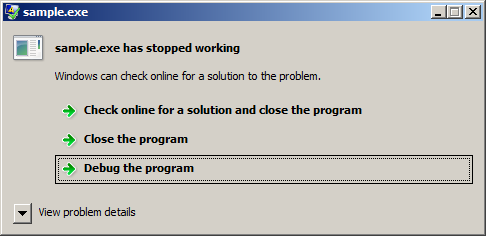
You can easily try Dr. Mingw by building and running the included sample. Depending of your Windows version, you'll see a familiar dialog:
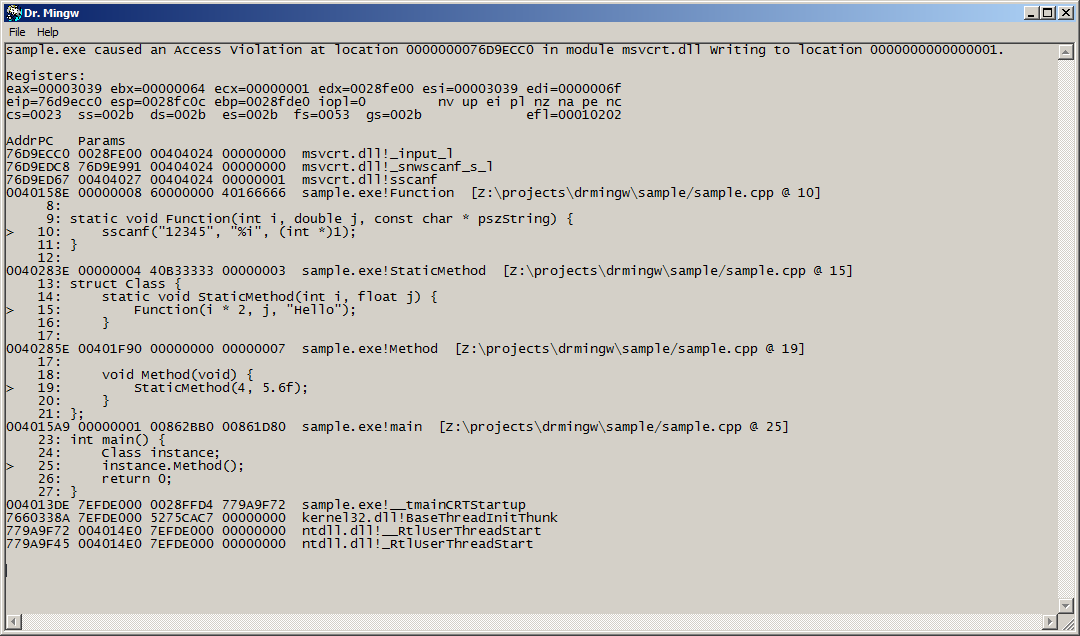
If you request to debug the program, Dr. Mingw will attach to the faulting application, collect information about the exception, and display the dialog
To resolve the addresses it's necessary to compile the application with debugging information. In case of address is in a DLL with no debugging information, it will resolve to the precedent exported symbol.
The following table describes the Dr. Mingw command-line options. All command-line options are case-sensitive.
| Short | Long | Action |
|---|---|---|
| -h | --help | Print help and exit |
| -V | --version | Print version and exit |
| -i | --install | Install as the default JIT debugger |
| -u | --uninstall | Uninstall |
| -p pid | --process-id=pid | Attach to the process with the given identifier |
| -e event | --event=event | Signal an event after process is attached |
| -b | --breakpoints | Treat breakpoints as exceptions |
| -v | --verbose | Verbose output |
The MgwHelp library aims to be a drop-in replacement for the DbgHelp library, that understand MinGW symbols. It provides the same interface as DbgHelp library, but it is able to read the debug information produced by MinGW compilers/linkers.
MgwHelp is used by Dr.MinGW and ExcHndl below to lookup symbols.
But the hope is that it will eventually be used by third-party Windows development tools (like debuggers, profilers, etc.) to easily resolve symbol on binaries produced by the MinGW toolchain.
MgwHelp relies on libdwarf to read DWARF debugging information.
NOTE: It's still work in progress, and only exports a limited number of symbols. So it's not a complete solution yet
The exchndl.dll is a embeddable exception handler. It produces the similar output to Dr. Mingw, but it can be bundled into your applications. The exception handling routine runs in the same process context of the faulting application.
If you deploy ExcHndl together your own programs you can have almost the same exception information that you would get with Dr. Mingw, but with no need for the end user to install Dr. Mingw installed.
You can use ExcHndl by:
-
including
exchndl.dll,mgwhelp.dll,dbghelp.dll,dbgcore.dll,symsrv.dll, andsymsrv.yeswith your application binaries -
pass
-lexchndlto GNU LD when linking your program -
call
ExcHndlInit()from your main program -
you can also override the report location by invoking the exported
ExcHndlSetLogFileNameAentry-point.
You can also use ExcHndl by merely calling LoadLibraryA("exchndl.dll") for historical reasons, but that's no longer recommended.
The sample sample.exe application uses the second method above. Copy all DLLs mentioned above to the executable directory. When you run it, even before general protection fault dialog box appears, it's written to the sample.RPT file a report of the fault.
Here is how sample.RPT should look like:
-------------------

Error occurred on Tuesday, June 25, 2013 at 08:18:51.

z:\projects\drmingw\sample\sample.exe caused an Access Violation at location 74D2ECC0 in module C:\Windows\syswow64\msvcrt.dll Writing to location 00000001.

Registers:
eax=00003039 ebx=00000064 ecx=00000001 edx=0028fe50 esi=00003039 edi=0000006f
eip=74d2ecc0 esp=0028fc5c ebp=0028fe30 iopl=0         nv up ei pl nz na pe nc
cs=0023  ss=002b  ds=002b  es=002b  fs=0053  gs=002b             efl=00010202

AddrPC   Params
74D2ECC0 0028FE50 00403064 00000000  msvcrt.dll!_strxfrm_l
74D2EDC8 74D2E991 00403064 00000000  msvcrt.dll!sscanf
74D2ED67 00403067 00403064 00000001  msvcrt.dll!sscanf
004013DE 00000008 60000000 40166666  sample.exe!Function  [z:\projects\drmingw\sample/sample.cpp @ 12]
00401D3E 00000004 40B33333 0028FF08  sample.exe!Class::StaticMethod(int, float)  [z:\projects\drmingw\sample/sample.cpp @ 17]
00401D5E 00401970 00714458 0000000C  sample.exe!Class::Method()  [z:\projects\drmingw\sample/sample.cpp @ 21]
004013F9 00000001 00572F38 00571B38  sample.exe!main  [z:\projects\drmingw\sample/sample.cpp @ 27]
004010FD 7EFDE000 F769D382 00000000  sample.exe
77269F42 00401280 7EFDE000 00000000  ntdll.dll!RtlInitializeExceptionChain
77269F15 00401280 7EFDE000 00000000  ntdll.dll!RtlInitializeExceptionChain
Dr. Mingw also includes a Windows replica of GLIBC's catchsegv utility, which enables you to run a program, dumping a stack backtrace on any fatal exception. Dr. Mingw's catchsegv has additional features:
-
will collect and dump all
OutputDebugStringmessages to stderr -
will trap if the application creates a modal dialog (e.g.
MessageBox) -
will follow all child processes
-
allows to specify a time out
All the above make Dr. Mingw's catchsegv ideally suited for test automation.
Here's the how to use it:
usage: catchsegv [options] <command-line>

options:
  -? displays command line help text
  -v enables verbose output from the debugger
  -t <seconds> specifies a timeout in seconds
  -1 dump stack on first chance exceptions
Make sure you don't use Dr.Mingw and exchndl at the same time -- the latter seems to interfere with the former by some obscure reason.
This options are essential to produce suitable results are:
-
-g: produce debugging information -
-fno-omit-frame-pointer: use the frame pointer (frame pointer usage is disabled by default in some architectures likex86_64and for some optimization levels; and it may be impossible to walk the call stack without it)
You can choose more detailed debug info, e.g., -g3, -ggdb. But so far I have seen no evidence this will lead to better results, at least as far as Dr.MinGW is concerned.
Callers put the return IP address on the stack. Therefore the source lines we get when looking the address is not the line of the call, but instead the line of the instruction immediately succeeding the call.
Dr. Mingw uses DbgHelp to handle .PDB files so it has the same behavior.
If you test on the machine you built, you typically need to do nothing. Otherwise you'll need to tell where your .PDBs are through the _NT_SYMBOL_PATH environment variable.
drmingw -b -p 12345
or
drmingw -b -p application.exe
- binutil's addr2line (included in MinGW)
- cv2pdb - DWARF to PDB converter
- Breakpad
- Crashpad
- CrashRpt
- dbg
- A Crash Course on the Depths of Win32 Structured Exception Handling, MSJ January 1997
- MSJEXHND - Part 1, Under the Hood, MSJ April 1997
- MSJEXHND - Part 2, Under the Hood, MSJ May 1997
- Bugslayer, MSJ, August 1998
- The Win32 Debugging Application Programming Interface
- Using the Windows debugging API on Windows 64
- About Exceptions and Exception Handling
- Microsoft PDB format


