Along with the development of e-commerce platforms in Vietnam in recent years. I want to collect data and analyze products so that we can discover the product's price distribution, distribution of quantity sold, and rating of product
- selenium, BeautifulSoup, chromedriver for crawl data in website
- numpy, pandas, seaborn, matplotlib for EDA process
- Collecting
- Collect links of product on Shopee’s search page
- Access each link into list to get the necessary data
- Cleaning
- Fill missing value
- Cleaning data in some field
- Exploratory Data Analysis
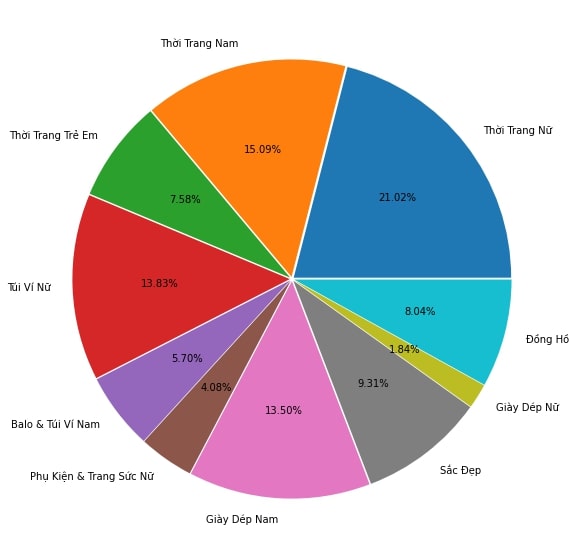
- Ratio of categories
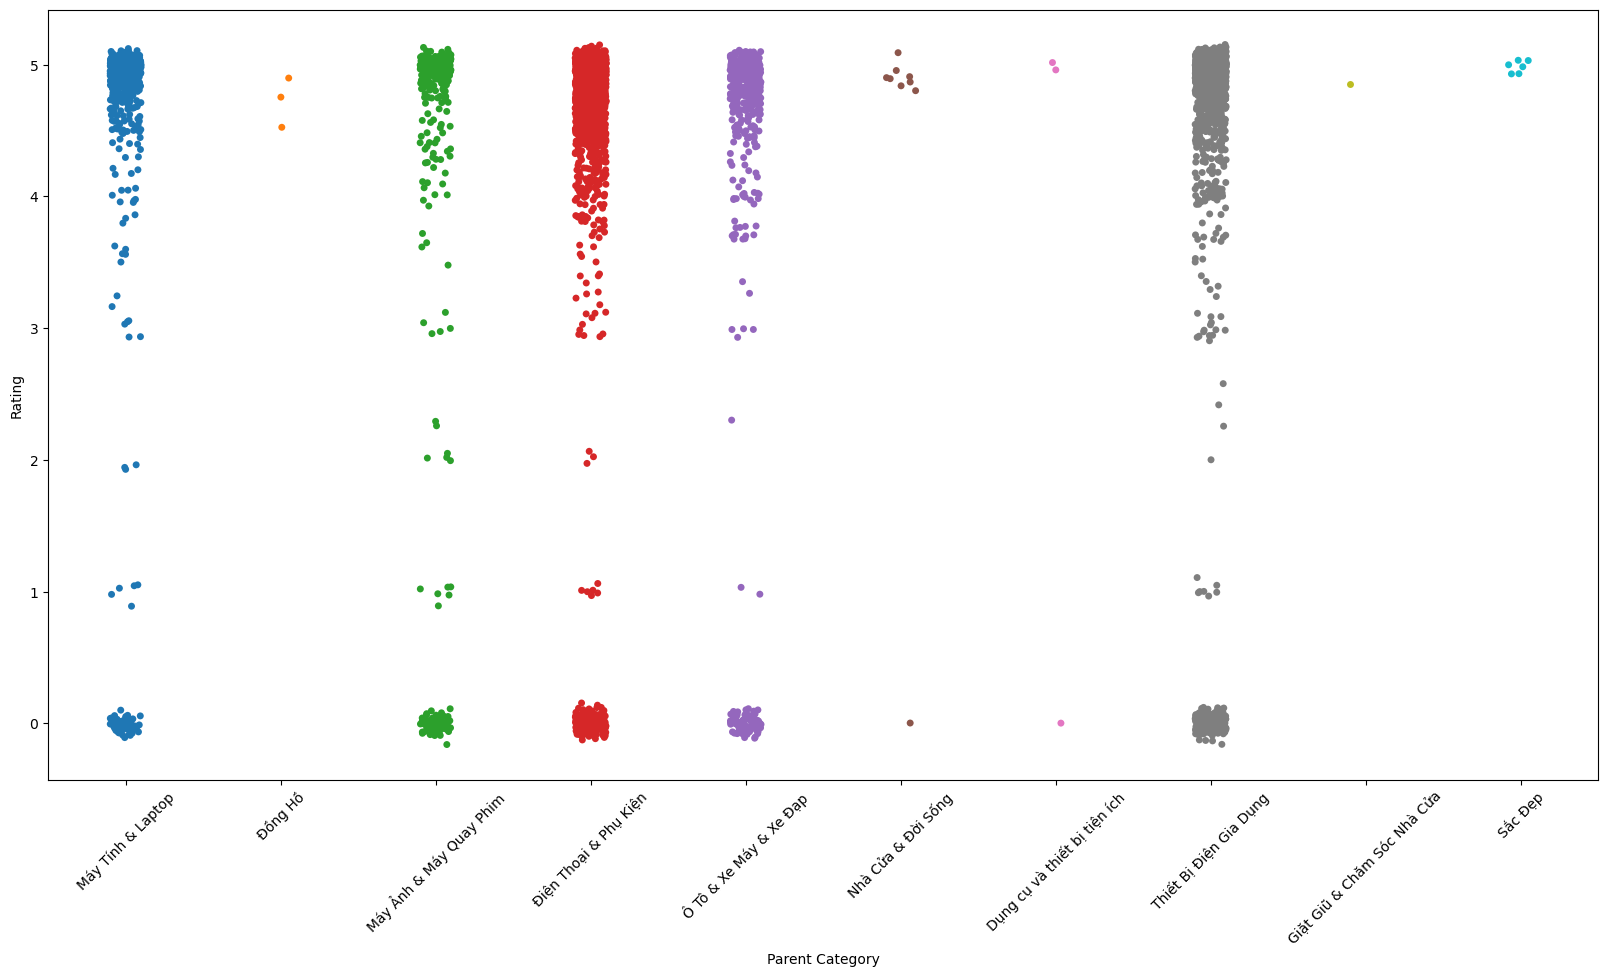
- Rating of categories
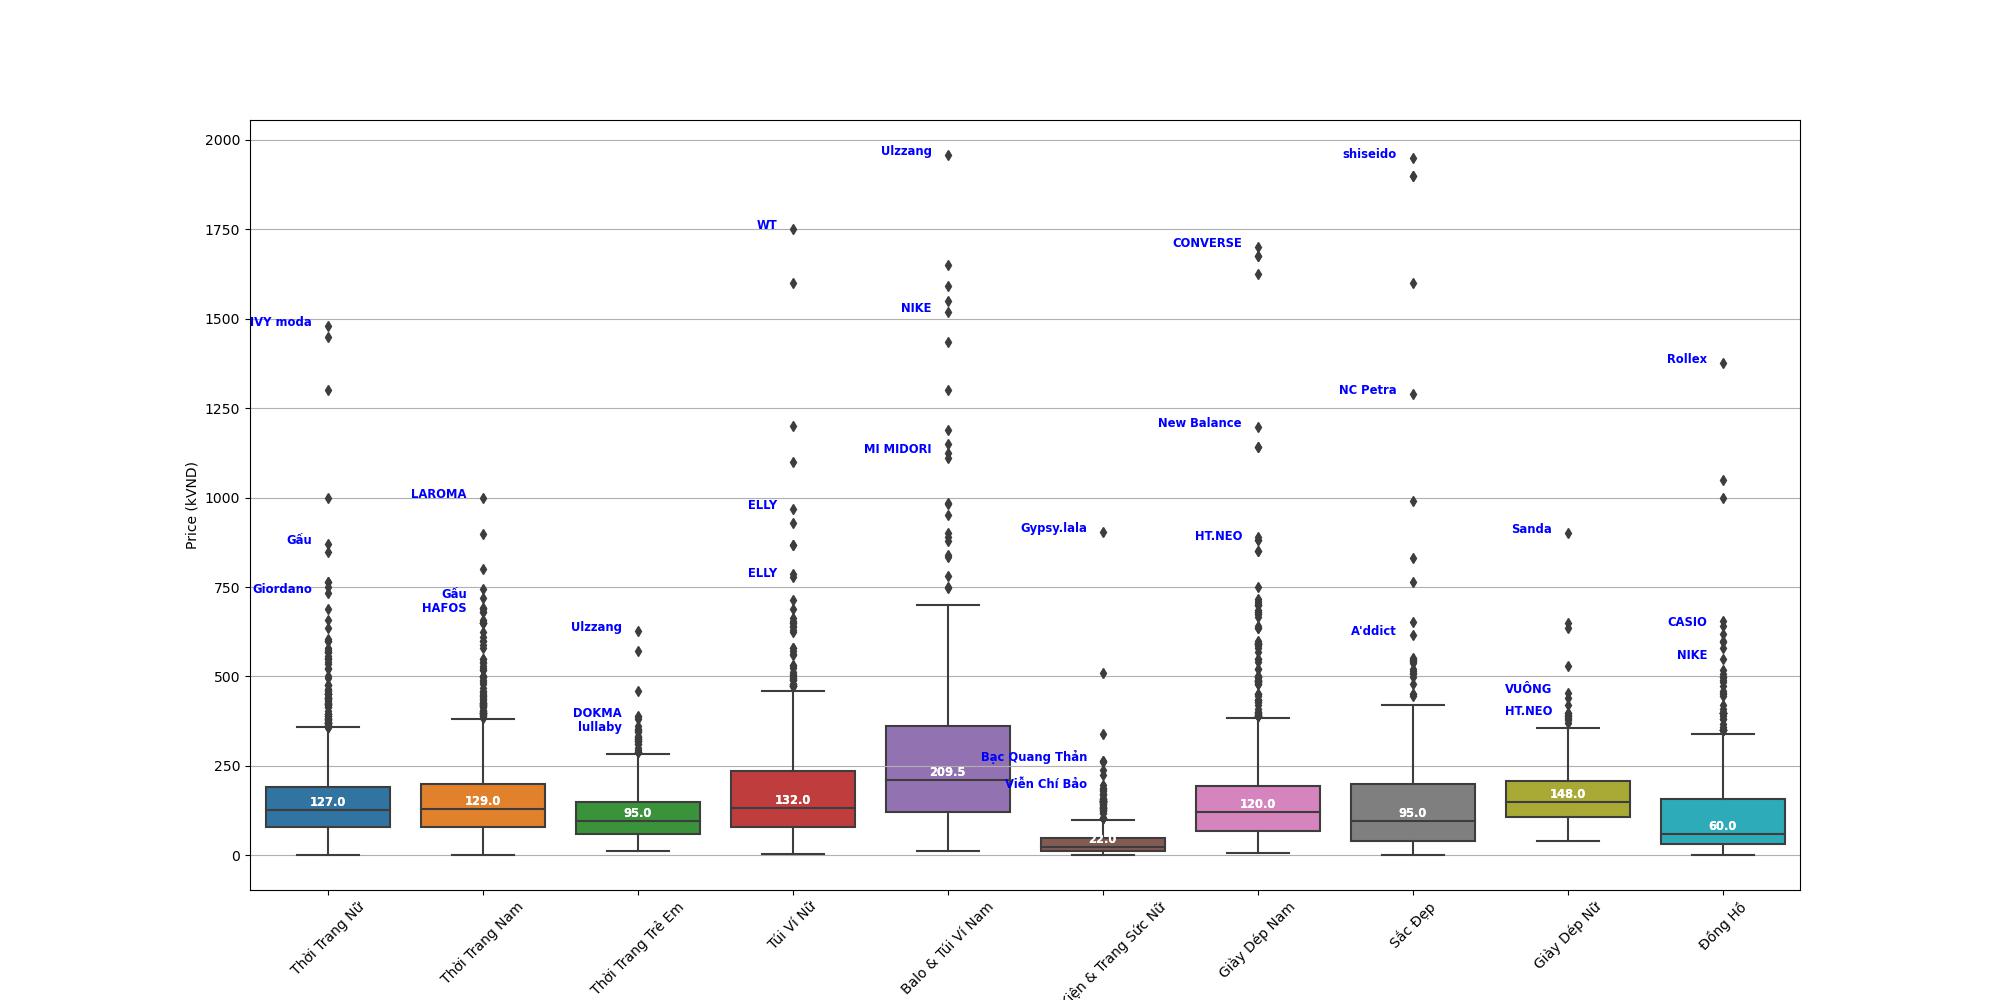
- Price of categories
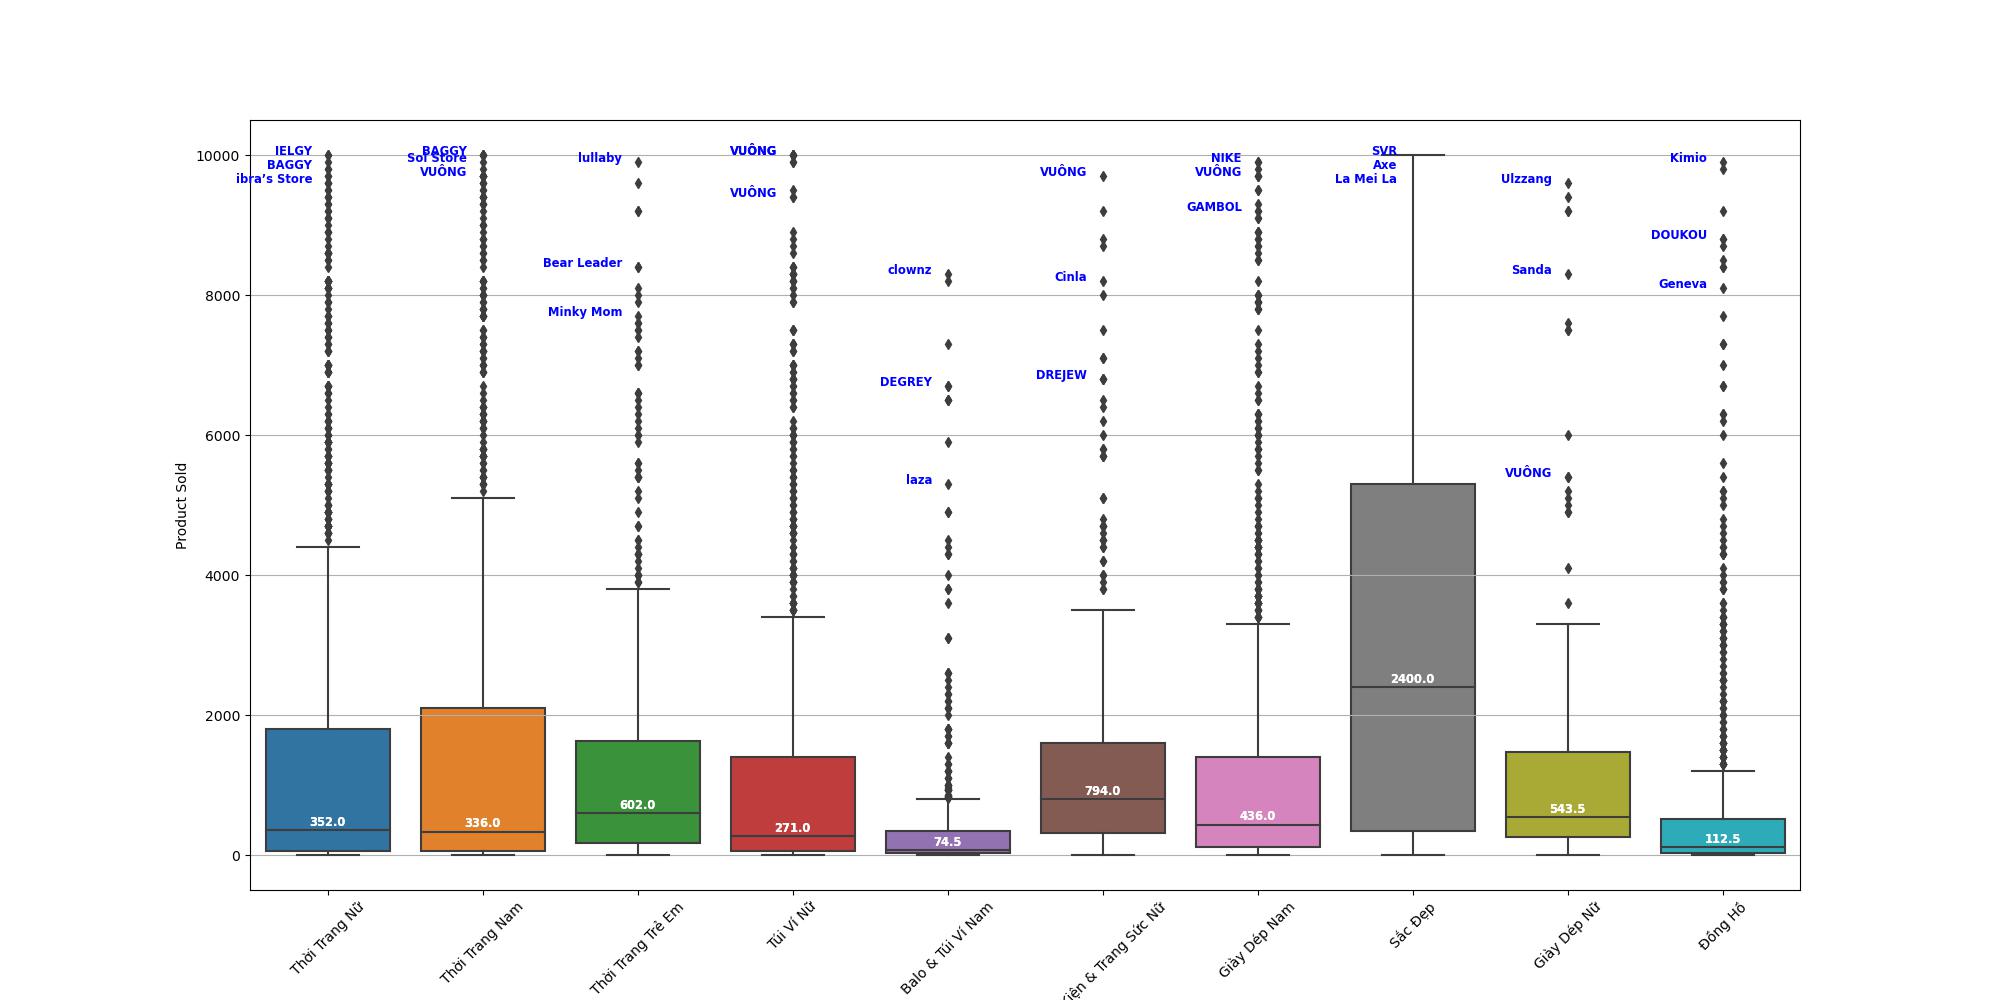
- Number of product sold of categories
- Correlation Heatmap
- Modeling
- Relationship between Total rating and product sold
-
Apply 3 machine learning algorithms: Linear Regression, Descision Tree and XGBoost
- Using cross validation with k-fold = 5 to evaluate dataset
- Through this project, I was able to practice and understand more about data collection and processing to better understand the data and derive knowledge from that data.


