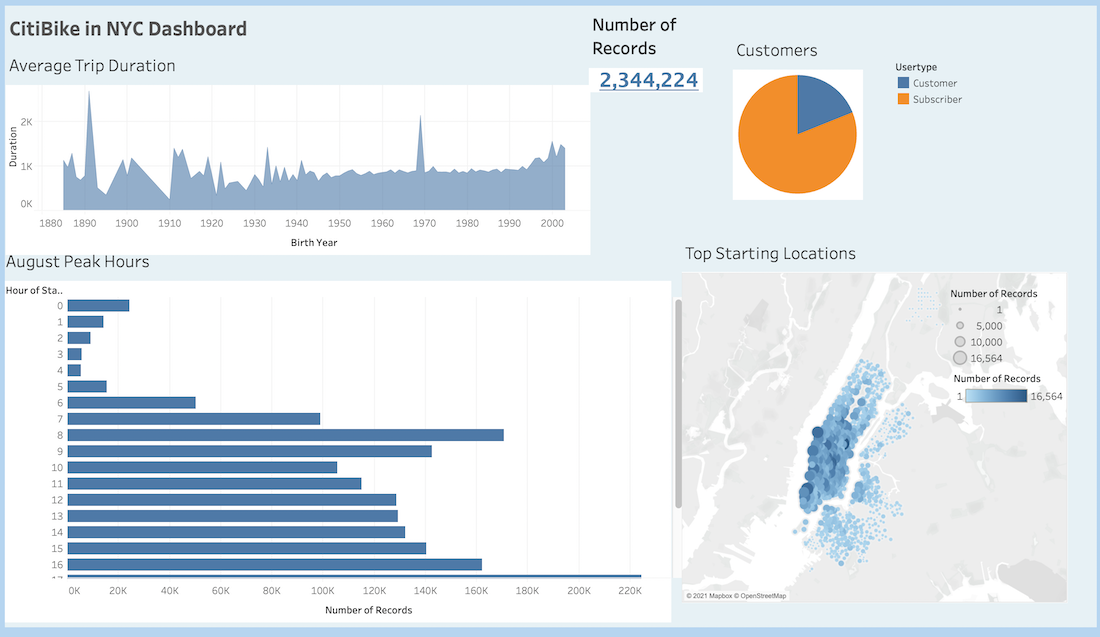
- Creating tableau to analyze bikeshare data in nyc. Refer to Tableau_Public_Module Challenge and Tableau_Public_Module
- Find out total of 2,344,224 trips
- Find out August Peak Hours
- Find out Top Starting Locations
- Find out User trips by gender by weekday
- Find out Checkout Times For Gender
