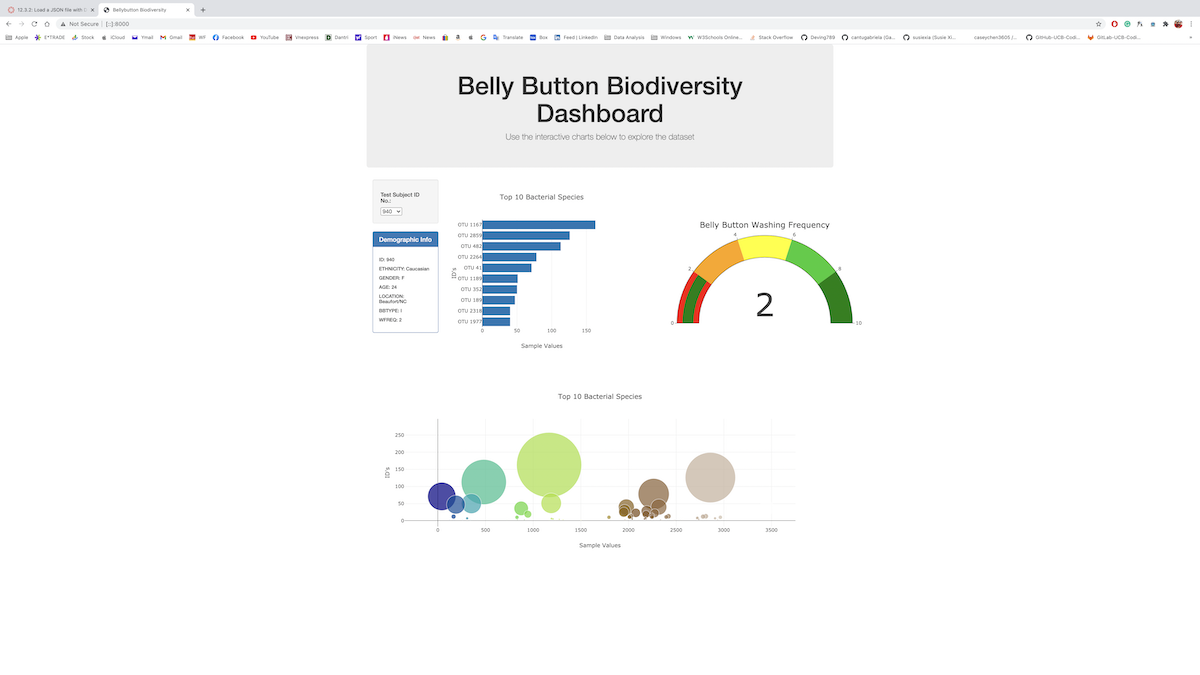
- Using Plotly and javascript to build an HTML project that has a customized dashboard with a bar, bubble and gauge chart. Refer to https://hieppham8083.github.io/plotly_deployment/
- Create a Horizontal Bar Chart
- Create a Bubble Chart
- Create a Gauge Chart
- Customize the Dashboard
