A toolbox for debugging Docker container and Kubernetes with visual web UI. You can start the debugging journey on any docker container host! You can use kube-debug to debug the local host, the local container, any kubernetes node and any kubernetes pod of any namespace. It can help you to automatically complete the command line, and has a large number of visual debugging tools.
You can download the kube-debug-*.tgz package from https://github.com/cloudnativer/kube-debug/releases.
For example, we have downloaded the kube-debug-v0.1.0-x86.tgz package.
# cd ~/
# wget https://github.com/cloudnativer/kube-debug/releases/download/v0.1.0/kube-debug-v0.1.0-x86.tgz
# tar -zxvf kube-debug-x86-v0.1.0.tgz
# cd ~/kube-debug/
Execute the following command to initialize the local debug environment:
# cd ~/kube-debug/
# ./kube-debug -init
You can use kube-debug to debug the local host, the local container, any kubernetes node and any kubernetes pod of any namespace.
For example, We can use kube-debug -localhost to debug the local host. Let's debug the local host , We can perform the following command operations:
# cd ~/kube-debug/
# ./kube-debug -localhost
After the command is executed, the following information will be displayed:
df02e84f5233e01309f3188d3ab5622df1c495d0c8b5f2c68247856d9c552625

Debug environment started successfully!

Notice: You can now enter the debugging interface in the following two ways:
        (1) Using a web browser to access http://Localhost's_IP:3080 Debug! (Recommended URL: http://192.168.1.12:3080)
        (2) Use the command to debug directly on the local host: docker exec -it kube-debug-localhost /bin/bash
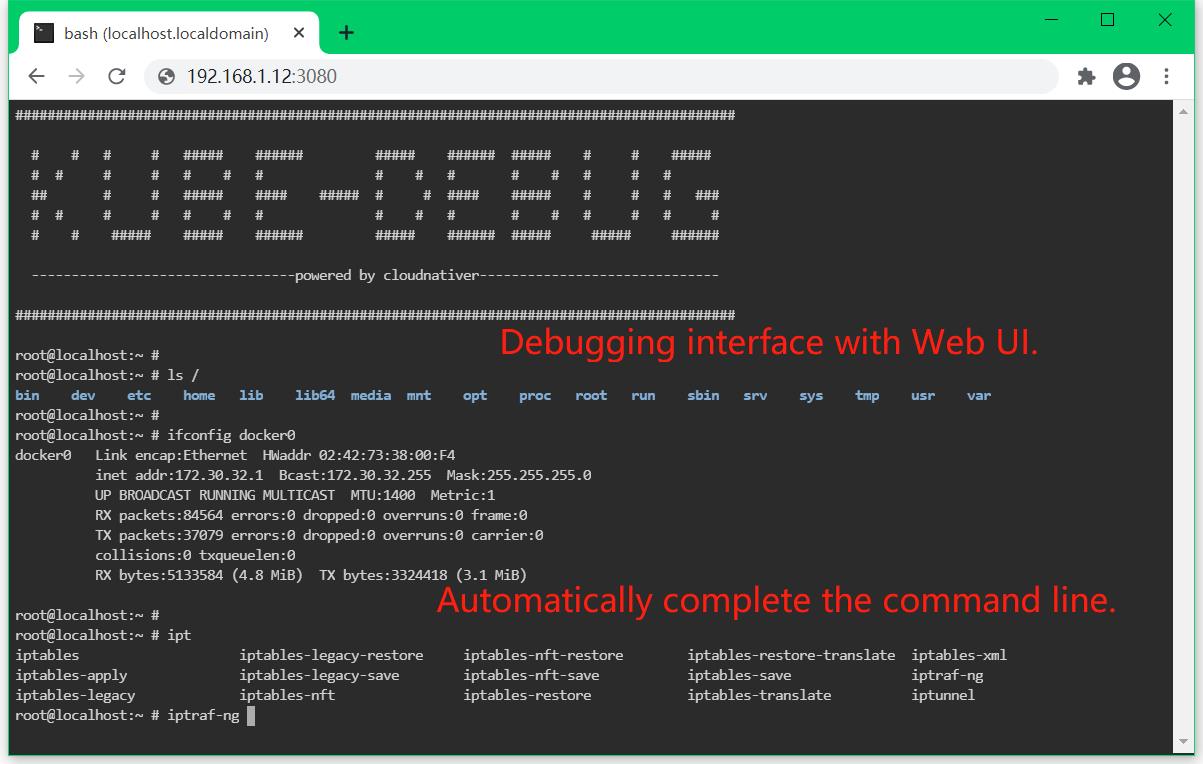
Now you can use a web browser to access http://192.168.1.12:3080 and enter the visual web ui for debugging.
 __________________
|  Web Browser UI  |
=============================================================================================================
=====| <- | -> | O |=====(  http://192.168.1.12:3080                                        )================
=============================================================================================================
|                                                                                                         | |
|  ##########################################################################################             | |
|                                                                                                         | |
|    #    #   #     #   #####    ######         #####    ######  #####    #     #    #####                | |
|    #  #     #     #   #    #   #              #    #   #       #    #   #     #   #                     | |
|    ##       #     #   #####    ####    #####  #     #  ####    #####    #     #   #   ###               | |
|    #  #     #     #   #    #   #              #    #   #       #    #   #     #   #     #               | |
|    #    #    #####    #####    ######         #####    ######  #####     #####     ######               | |
|                                                                                                         | |
|    --------------------------------Powered By Cloudnativer-------------------------------               | |
|                                                                                                         | |
|  ##########################################################################################             | |
|  root@localhost:~ #                                                                                     |||
|  root@localhost:~ #                                                                                     |||
|  root@localhost:~ #                                                                                     |||
|  root@localhost:~ # iptraf-ng |                                                                         | |
=============================================================================================================
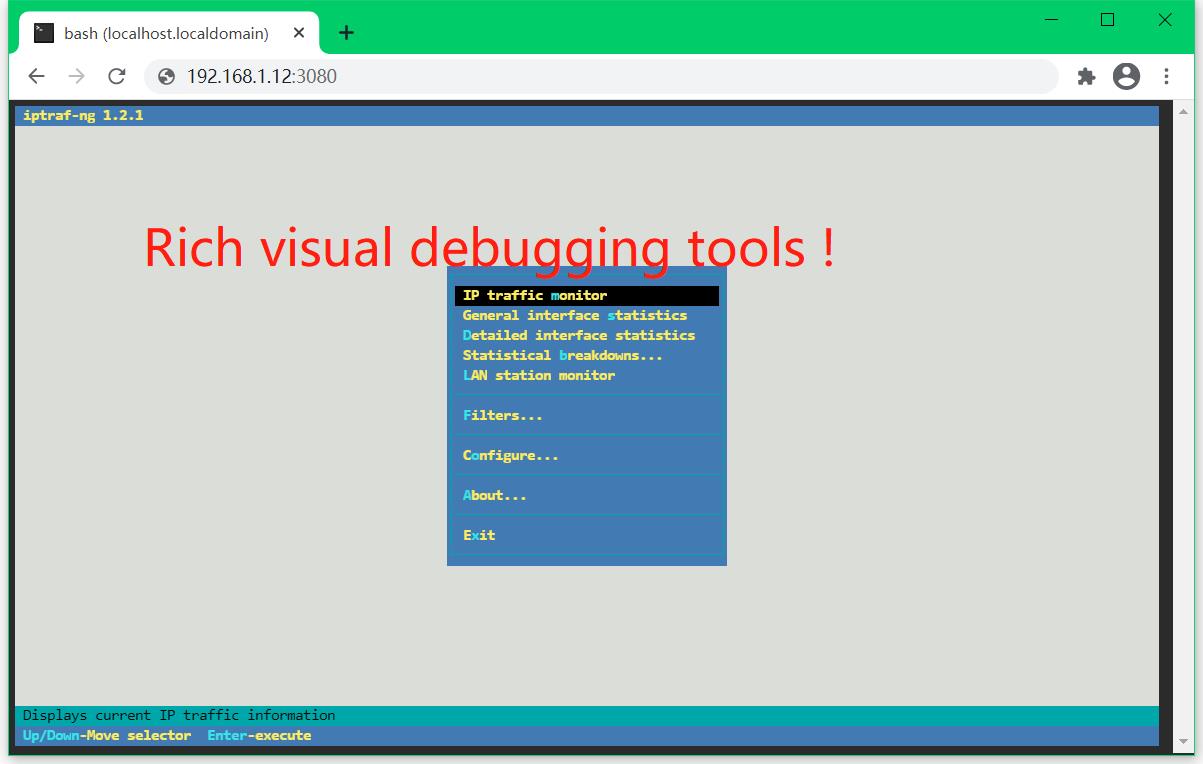
Here we can easily do visual debugging, Automatically complete the command line, Rich visual debugging tools:
In addition, we can also use the docker exec -it kube-debug-localhost /bin/bash command to directly log in to the debugging container for debugging.
[root@localhost ~]# docker exec -it kube-debug-localhost /bin/bash
##########################################################################################

  #    #   #     #   #####    ######         #####    ######  #####    #     #    #####
  #  #     #     #   #    #   #              #    #   #       #    #   #     #   #
  ##       #     #   #####    ####    #####  #     #  ####    #####    #     #   #   ###
  #  #     #     #   #    #   #              #    #   #       #    #   #     #   #     #
  #    #    #####    #####    ######         #####    ######  #####     #####     ######

  --------------------------------Powered By Cloudnativer-------------------------------

##########################################################################################
root@localhost:~ #
root@localhost:~ #
root@localhost:~ #
root@localhost:~ #
kube-debug integrates many debugging tools. You can click here to see more integrated tool list information.
We can use kube-debug -localhost to debug the local host. Let's debug the local host , We can perform the following command operations:
# cd ~/kube-debug/
# ./kube-debug -localhost
After the command is executed, the following information will be displayed:
df02e84f5233e01309f3188d3ab5622df1c495d0c8b5f2c68247856d9c552625

Debug environment started successfully!

Notice: You can now enter the debugging interface in the following two ways:
        (1) Using a web browser to access http://Localhost's_IP:3080 Debug! (Recommended URL: http://192.168.1.12:3080)
        (2) Use the command to debug directly on the local host: docker exec -it kube-debug-localhost /bin/bash
Now you can use a web browser to access http://192.168.1.12:3080 and enter the Visual Web UI for debugging. You can also use the docker exec -it kube-debug-localhost /bin/bash command to directly log in to the debugging container for debugging.
We can use kube-debug -container <container id or container name> to debug the local container. Let's debug the local container with ID 9a64c7a0d6bd , We can perform the following command operations:
# cd ~/kube-debug/
# ./kube-debug -container "a1aa35697643" -debugport 38080
After the command is executed, the following information will be displayed:
efa3cc35dd414e4217c880fe269f375cd512fe4f5122e0ccc39719c83d8c30e1

Debug environment started successfully!

Notice: You can now enter the debugging interface in the following two ways:
        (1) Using a web browser to access http://Localhost's_IP:38080 Debug! (Recommended URL: http://192.168.1.12:38080)
        (2) Use the command to debug directly on the local host: docker exec -it kube-debug-container-a1aa35697643 /bin/bash
Now you can use a web browser to access http://192.168.1.12:38080 and enter the Visual Web UI for debugging. You can also use the docker exec -it kube-debug-container-a1aa35697643 /bin/bash command to directly log in to the debugging container for debugging.
We can use kube-debug -node <kubernetes node IP> to debug any kubernetes node. Let's debug the kubernetes node with IP 192.168.1.13 , We can perform the following command operations:
# cd ~/kube-debug/
# ./kube-debug -node "192.168.1.13" -debugport 38081
After the command is executed, the following information will be displayed:
Preparing kube-debug environment, Please wait!

Checking target k8s-node (192.168.1.13), please wait...
Checking debugging environment...
Enabling debugging process...
0d1e548b7f6012dea80e2ccadb8b6ba874fcf20a1a4b914469093e88f85905e3

Debug environment started successfully!

Notice: You can now enter the debugging interface in the following two ways:
        (1) Using a web browser to access http://k8s-node's_IP:38081 Debug! (Recommended URL: http://192.168.1.13:38081)
        (2) Login to the target k8s-node host (192.168.1.13), debugging with commands: docker exec -it kube-debug-node-192.168.1.13 /bin/bash
Now you can use a web browser to access http://192.168.1.13:38081 and enter the Visual Web UI for debugging. You can also Login to the target k8s-node host (192.168.1.13), debugging with commands docker exec -it kube-debug-node-192.168.1.13 /bin/bash .
We can use kube-debug -pod <pod name> -namespace <namespace> -kubeconfig <kubeconfig file> to debug any kubernetes pod. Let's debug the test-6bfb69dc64-hdblq pod in the testns namespace , We can perform the following command operations:
# cd ~/kube-debug/
# ./kube-debug -pod "test-6bfb69dc64-hdblq" -namespace "testns" -kubeconfig "/etc/kubernetes/pki/kubectl.kubeconfig" -debugport 38082
After the command is executed, the following information will be displayed:
Preparing kube-debug environment, Please wait!

Warning: If you don't get through the local ssh key to the target k8s-node (192.168.1.15), please wait and enter the password for target k8s-node!
Please wait a moment...
[email protected]'s password: <Enter Password>

Checking target k8s-node (192.168.1.15), please wait...
Checking debugging environment...
Enabling debugging process...
4d6b52c485c4c9a5c10c2dffc2c322562acfee6ca73d3e94fd893efddfe36a91

Debug environment started successfully!

Notice: You can now enter the debugging interface in the following two ways:
        (1) Using a web browser to access http://k8s-node's_IP:38082 Debug! (Recommended URL: http://192.168.1.15:38082)
        (2) Login to the target k8s-node host (192.168.1.15), debugging with commands: docker exec -it kube-debug-pod-test-6bfb69dc64-hdblq /bin/bash
Now you can use a web browser to access http://192.168.1.15:38082 and enter the Visual Web UI for debugging. You can also Login to the target k8s-node host (192.168.1.15), debugging with commands docker exec -it kube-debug-pod-test-6bfb69dc64-hdblq /bin/bash .
We can clean up the local machine's debug environment by executing kube-debug -clear . The following command will automatically clean up the residual temporary cache file, debug container, debug process and other information.
# cd ~/kube-debug/
# ./kube-debug -clear
Now the debug environment of the local machine is cleaned up.
The parameters about kube-debug can be viewed using the kube-debug -help command. You can also see more detailed parameter introduction here.
kube-debug integrates many debugging tools. You can click here to see more integrated tool list information.
The build can be completed automatically by executing the make command. You can also see more detailed build instructions here.


