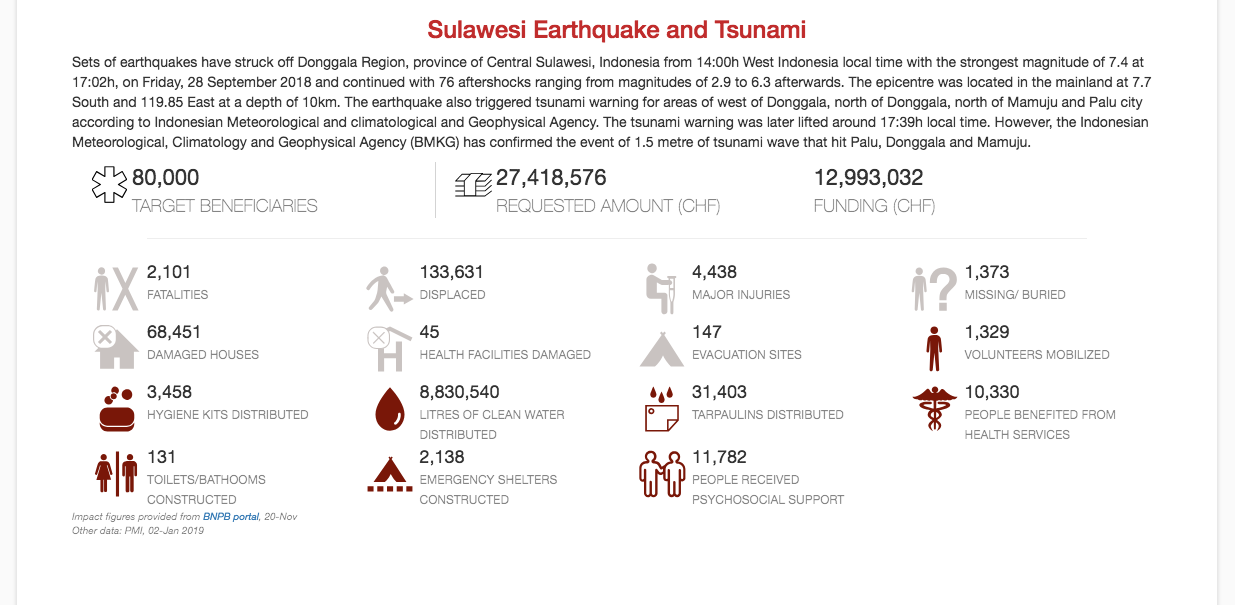
This project allows you to create a dashboard with high-level numbers for a disaster impact and response. The primary use case is when a single IFRC Appeal includes multiple operations. For example, the 2018 Indonesia earthquakes and tsunami appeal that included operations to separate disaster events in both Sulawesi and Lombok. Pages on the IFRC GO platform are created for each appeal, not operation, and only has a single overview numbers section. This project allows you to create an overview section for each operation and then add them to a GO page via an iframe embed in the "Additional Graphics" section.
- Request to be a contributor or fork the repository, clone, and create a new branch for your changes.
- Make a copy one of the dashboard folders (e.g.
.\2018-idn-sulawesi\) and rename it. It's nice to stick to the naming convention of 4 digit year, dash, alpha 3 iso code for the country, dash, descriptor. All lowercase. For a multi-country disaster, you'll need to pick one country or think of something creative. - Create a Google Spreadsheet, name a tab
overviewand create a table like the below:
| key | value | label | img | color |
|---|---|---|---|---|
| overview-text | Type an overview description here. | |||
| key-target | 80,000 | Target beneficiaries | ||
| key-money1 | 1,500,000 | Requested amount (CHF) | ||
| key-money2 | 1,200,750 | Funding (CHF) | ||
| secondary-figure | 870 | Fatalities | dead.svg | |
| secondary-figure | 30,000 | Displaced | displaced.svg | |
| secondary-figure | 673 | Volunteers mobilized | person.svg | primary-darkred-0 |
| secondary-figure | 10,330 | People benefited from health services | health.svg | primary-darkred-0 |
| sources | Type a list of sources here. |
- However, you can add or delete as many
secondary-figurerows as you want. - For each
secondary-figurerow, edit thevalueandlabel, and add a filename from the./img/secondary-icons/folder in theimgcolumn. Optionally, you can adjust the color of the icon by adding a value from the "secondary-figure color options" section below in thecolorcolumn. - For your list of sources you can include links using an html anchor tag. The
target="_blank"in the below example requests the browser to open the link in a new tab. Adding a<br>will insert a line break.
Impact figures provided from <a href="https://sites.google.com/view/gempadonggala/beranda" target="_blank">BNPB portal</a>, 20-Nov
<br>Other data: PMI, 02-Jan 2019
- This project uses Tabletop.js to load the Google spreadsheet data. Follow the instructions for "1) Publishing your Google Sheet" to get the URL for your data.
- In the
index.htmlfile, edit what should be about line 70 so that is has the URL for your data.
<script>
var publicSpreadsheetUrl = 'https://docs.google.com/spreadsheets/d/1N3g6lG4J16qCJ0dK2W0KhNF4h__jmR5Nhx6WV7oHaZg/';
</script>
- While you're editing the
index.htmlfile, change what should be about line 27 so that it has the title for your new dashboard.
<div class="row text-center">
  <h3 class="gored">My Dashboard Title</h3>
</div>
- To test your dashboard locally I suggest using node.js and the
http-serverpackage, or using the built-in web server in Python usingpython -m SimpleHTTPServer. - When you're ready, push your branch and edits up to GitHub. Then open a pull request into the
gh-pagesbranch of the repository. - The code to embed within a Snippet on an IFRC GO page should look something like the below. You'll need to adjust the height value according to how many rows of secondary icons you end up having. You want the iframe tall enough so that a scroll bar doesn't appear at most screen sizes. You can include more than one iframe embed in a single Snippet object, just add a line break between each with a
<br>.
<iframe width="100%" height="500px" frameborder="0" src="https://americanredcross.github.io/disaster-metrics-dashboard/2018-idn-lombok/"></iframe>
<br>
(this is the default color)
ifrcprimary-red-0primary-darkred-0primary-darkred-1primary-darkred-2primary-grey-0primary-grey-1primary-grey-2secondary-yellow-0secondary-yellow-1secondary-yellow-2secondary-orange-0secondary-orange-1secondary-orange-2secondary-blue-0secondary-blue-1secondary-blue-2secondary-magenta-0secondary-magenta-1secondary-magenta-2secondary-green-0secondary-green-1secondary-green-2secondary-darkblue-0secondary-darkblue-1secondary-darkblue-2secondary-purple-0secondary-purple-1secondary-purple-2secondary-darkgreen-0secondary-darkgreen-1secondary-darkgreen-2
- If using Adobe Illustrator to save a new SVG icon for the secondary-icon set, under Advanced Options, for CSS Properties, set the option to "Style Attributes" (not "style Elements").
- The color of new icons should be #C9C3C1 with 100% opacity.
- So that it's possible to change the color of an icon, the icon can't have any objects with transparent/white/etc fill.
