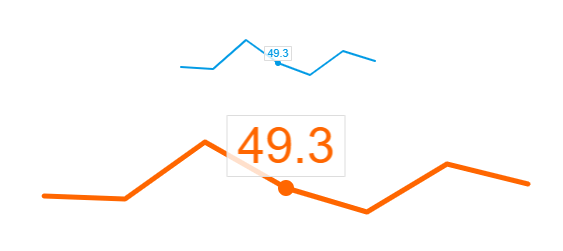
Simple react mini line chart using SVG. Suitable for tiny chart outline in table cell. Display value label when mouse over points.
// npm
npm install react-mini-chart

// or use yarn
yarn add react-mini-chart
default
<MiniChart dataSet={[0, -20, 343, 49.3, -100, 200, 78]}/>
custom
<MiniChart
  strokeColor="#FF6600"
  activePointColor="#FF6600"
  activePointRadius={8}
  strokeWidth={5}
  labelFontSize={50}
  width={500}
  height={100}
  dataSet={[0, -20, 343, 49.3, -100, 200, 78]}
/>
