To be updated soon. This work springboards from the PyNEMO Project.
Steps to take to install PyNEMO, creating a specific conda virtual environment is highly recommended. click here for more about virtual enviroments
-
Clone PyNEMO repository:
$ export PYNEMO_DIR=$PWD/PyNEMO $ git clone https://github.com/NOC-MSM/PyNEMO.git -
Create conda environment for PyNEMO:
$ cd $PyNEMO_DIR $ conda env create -f environment.yml -
Activate the new virtual environment:
$ conda activate pynemo -
To deactivate:
$ conda deactivate -
Make sure the Java Runtime Environment is set (e.g. livljobs*):
$ export JAVA_HOME=/usr/lib/jvm/java-1.8.0-openjdk-1.8.0.322.b06-1.el7_9.x86_64/ -
Install PyNEMO:
$ pip install .
This should result in PyNEMO being installed in the virtual environment, and can be checked by entering:
$ pynemo -v
Resulting in a help usage prompt:
$ usage: pynemo -g -s <namelist.bdy>
To use PyNEMO, the following command is entered: (the example will run an benchmarking test):
$ pynemo -s /path/to/namelist/file (e.g. ./inputs/namelist_remote.bdy)
For best experience create a new conda environment (e.g. pynemo-develop):
conda env create -f environment.yml
conda activate pynemo-develop
Before pushing to GitHub, run the following commands:
- Update conda environment:
make conda-env-update - Install this package:
pip install -e . - Sync with the latest template (optional):
make template-update - Run quality assurance checks:
make qa - Run tests:
make unit-tests - Run the static type checker:
make type-check - Build the documentation (see Sphinx tutorial):
make docs-build
The PyNEMO module can be tested using the bench marking namelist bdy file in the inputs folder. To check the outputs of the benchmark test, these can be visualised using the plotting script within the test_scripts folder. A local version of the benchmark data can be downloaded from here. The ./benchmark directory should reside as a subfolder of ./inputs. The following steps are required,
-
Run PyNEMO using the namelist file in the inputs folder (namelist_local.bdy) e.g.:
$ pynemo -s /path/to/namelist/file -
This will create two output files coordinates.bdy.nc and NNA_R12_bdyT_y1979_m11.nc in an ./outputs folder
-
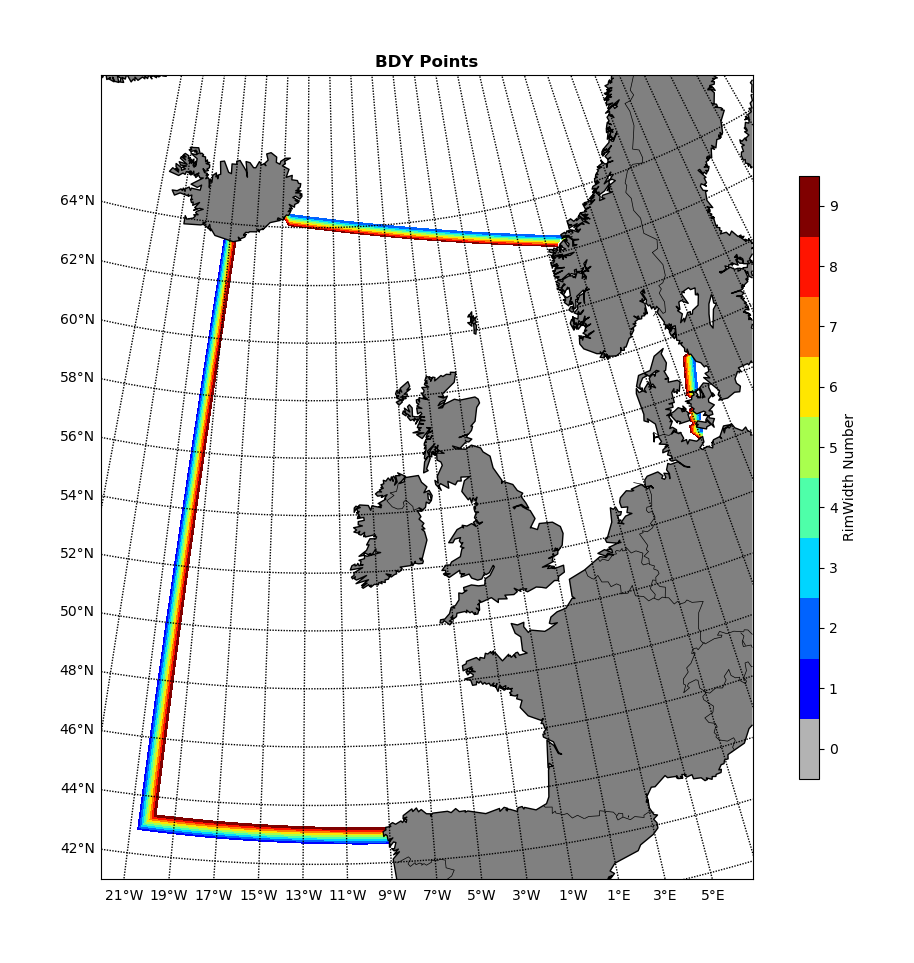
To check the coordinates.bdy.nc has the correct boundary points, the script bdy_coords_plot.py will plot the domain boundaries and shown the different locations of the rim width (increasing number should go inwards) This script is located in the test_scripts folder. There are also two plotting scripts in ./plotting, one does a similar job to bdy_coords_plot.py the other plots the tracer boundaries (as a pcolormesh) to help visualise the output.
-
The result should look like this (if using the current benchmark data)
-
Activate the new virtual environment:
conda activate pynemo -
Make sure all the directories and files are in place:
cd PyNEMO mkdir outputs ln -s /work/n01/n01/shared/jelt/FES2014 inputs/. <cp benchmark dir into inputs/benchmark> -
Press go:
pynemo -s inputs/namelist_local.bdy
Take about 120s. Generates 7 consitutents, using FES2014 data, written to `outputs`:
coordinates.bdy.nc
NNA_R12_bdytide_FES2014_M4_grd_V.nc
NNA_R12_bdytide_FES2014_Q1_grd_U.nc
NNA_R12_bdytide_FES2014_K2_grd_U.nc
NNA_R12_bdytide_FES2014_M4_grd_Z.nc
NNA_R12_bdytide_FES2014_Q1_grd_V.nc
NNA_R12_bdytide_FES2014_K2_grd_V.nc
...
