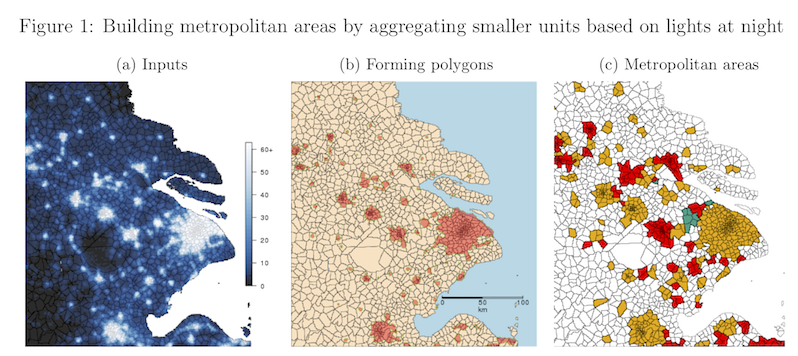
This repository contains code implementing the algorithm introduced in "Cities, Lights, and Skills in Developing Economies" in the Journal of Urban Economics by Jonathan Dingel, Antonio Miscio, and Don Davis.
The R code constructs metropolitan areas by aggregating finer geographic units on the basis of contiguous areas of light in nighttime satellite images.
As an example, we apply the algorithm to townships in China in 2000, as in Figure 1 of our article.
We thank Dylan Clarke, who wrote the majority of the R code appearing in this repository.
The algorithm is implemented in R.
We ran our code using R 3.5.1.
Our R code leverages spatial and measurement packages with additional system requirements, namely gdalUtils, rgdal, rgeos, sp, sf, and units.
We used GEOS 3.7.0, GDAL 2.3.2, PROJ 4.9, and udunits 2.2.
We expect the code to work on other versions too.
We automate the downloading of nighttime satellite images and invocation of the R script using Unix's make utility.
We strongly recommend a computing environment that supports GNU bash,
but this is not necessary to run the R code.
First, download (or clone) this repository by clicking the green Clone or download button above.
Uncompress the ZIP file into a working directory on your cluster or local machine.
You will see three folders: code, input, and output.
The code/params.yaml file included in the repository contains parameters to produce metropolitan areas for China in 2000 by aggregating townships on the basis of lights at night above a brightness threshold of 30.
The resulting output is a CSV file for all of China and the three panels used in Figure 1.
At the Unix/Linux/MacOSX command line, navigate to the code directory and type make.
cd code
make
This will download the nighttime satellite image from NOAA's website and then execute calls.R using the parameters declared in params.yaml.
- The
Makefileassumes that your machine is connected to the Internet and thatRscriptis a valid command name. - If you are in a computing environment that supports the Slurm workload manager (if the
Makefiledetects that the commandsbatchis valid), tasks will be submitted as jobs to your computing cluster. - If
sbatchis not available, theMakefilewill execute theRscriptcommand locally.
If your environment does not support make (e.g., some variants of Windows), follow the instructions in input/readme.md to download the NOAA TIF file to the input folder.
Then run calls.R.
Edit code/params.yaml file to declare the parameters for the year, geographic area, and projections you desire.
Identify the shapefile for your use case by editing the geo_shapefile path in line 12 of params.yaml.
Then run calls.R (the Makefile parses params.yaml, so you should be able to just type make after editing params.yaml).
You should never need to edit calls.R nor functions.R.
