A charting library in the style of Swift Charts. Uncharted replaces the declarative style of Swift Charts with an imperative one, and is available starting from iOS 15.
Uncharted can be added as a dependency in your project using Swift Package Manager.
// ...
dependencies: [
    .package(url: "https://github.com/jonaszell97/Uncharted.git", from: "0.1.0"),
],
// ...You can find the full documentation for this package here.
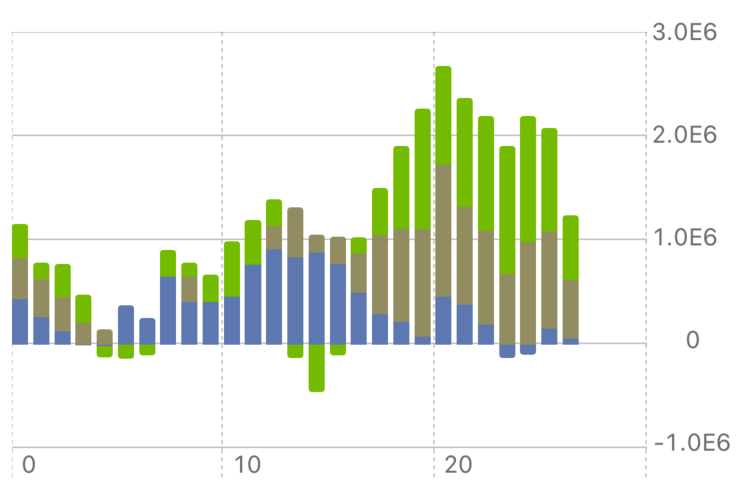
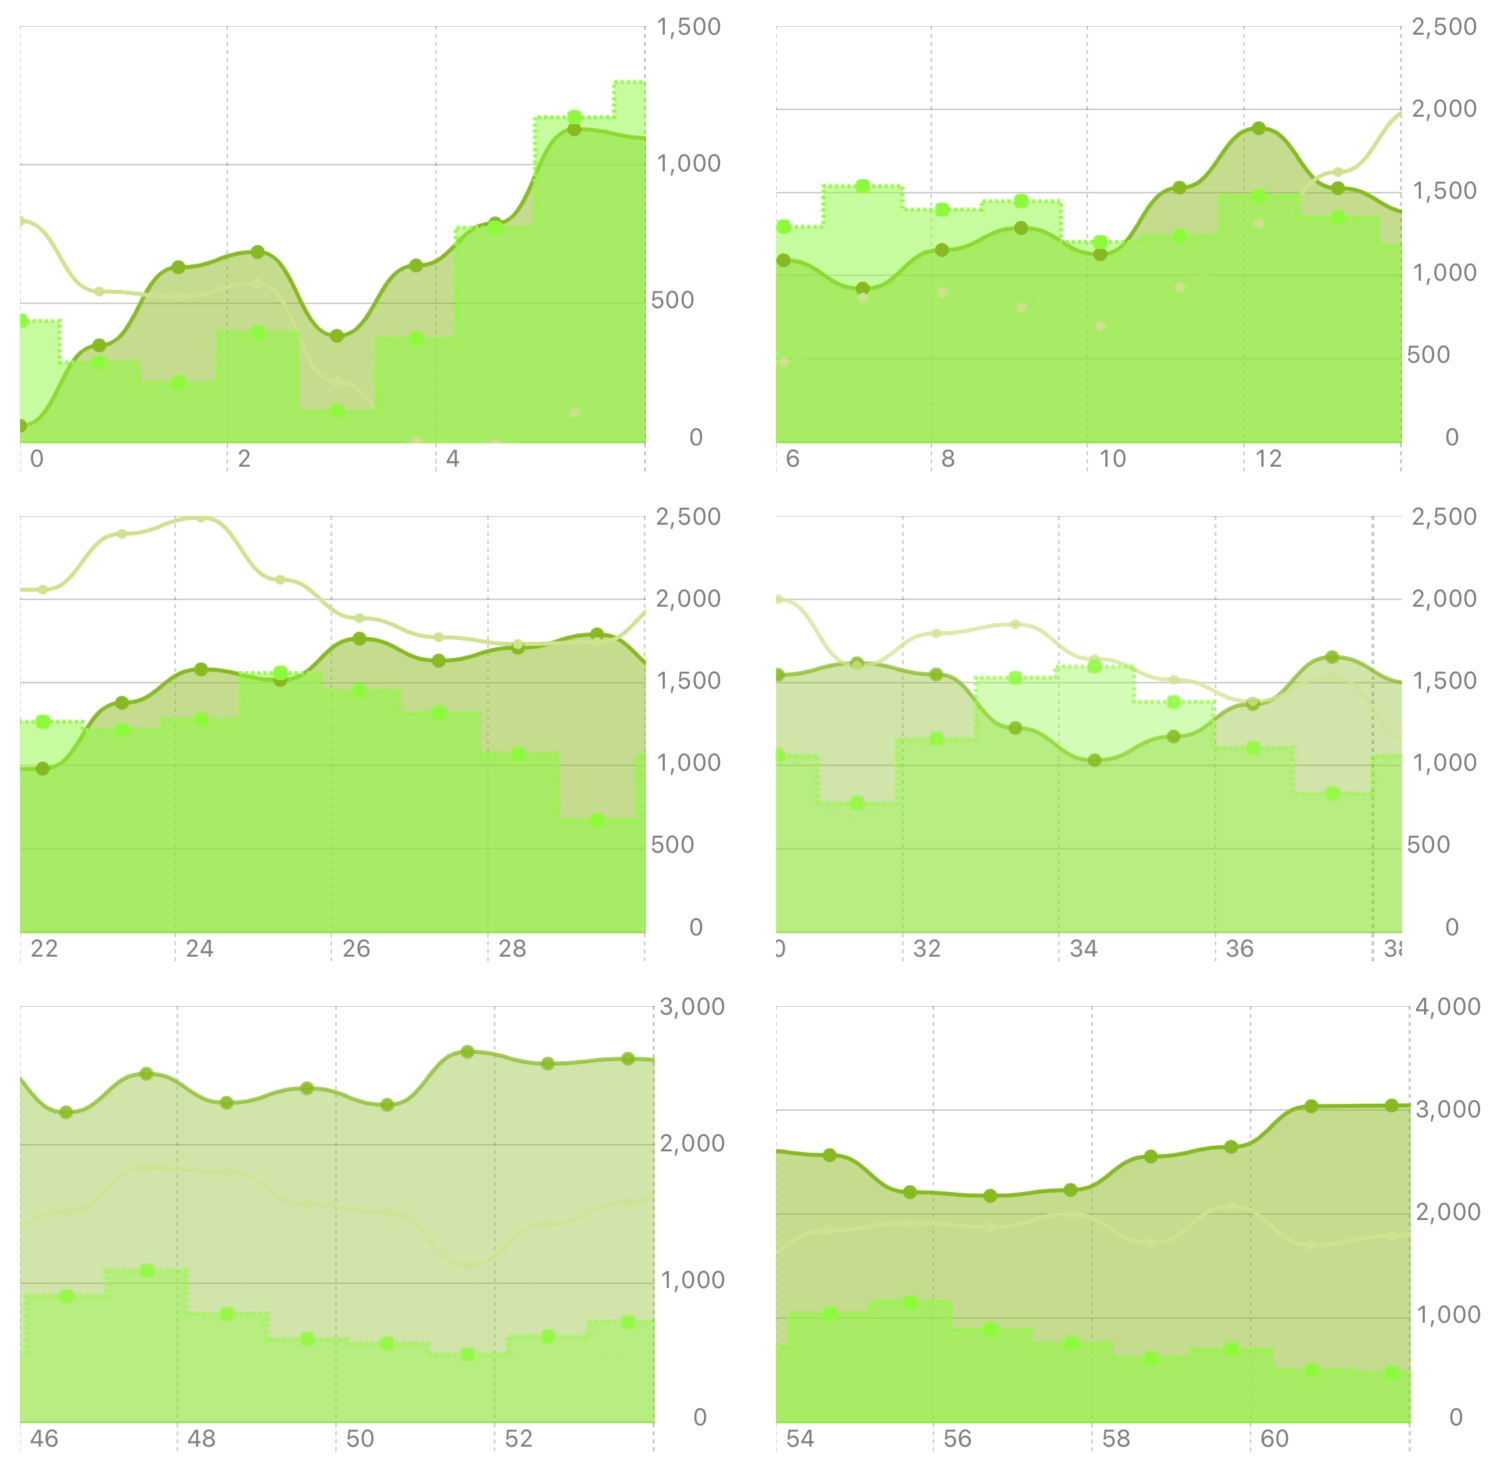
Uncharted currently supports bar charts (BarChart) as well as line charts (LineChart). To create a chart, you need to create an instance of ChartData. ChartData provides the chart's configuration via ChartConfig as well as its data using one or more DataSeries.
Charts are higly customizable. For bar charts, you can configure the bar width, color, and stacking behaviour using BarChartConfig. For line charts, you can configure line and point styles (LineStyle, PointStyle). All charts support different segmentation and scrolling behaviours (ChartScrollingBehaviour), custom data labels (DataFormatter), axis and grid styles (ChartAxisConfig, GridStyle), customizable tap actions (ChartTapAction), as well as markers (ChartMarker).
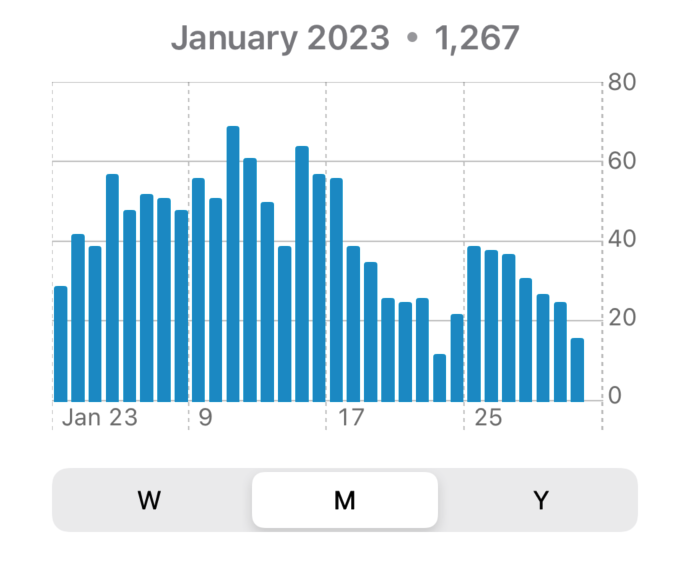
Both chart types can also be represented as a time series (TimeSeriesView), which aggregates and visualizes data in customizable date ranges.
The following gallery shows some examples of charts you can create with Uncharted.


