DNSC 6301 Project_Group 21
- Person or organization developing model:
Ke Chai, [email protected]
Le Zhang - [email protected]
Teddu Leela Bharani - [email protected]
Ashi Tiwari - [email protected]
- Model date: August, 2021
- Model version: 1.0
- License: MIT
- Model implementation code: DNSC_6301_Example_Project.ipynb
- Primary intended uses: This model is an example probability of default classifier, with an example use case for determining eligibility for a credit line increase.
- Primary intended users: Students in GWU DNSC 6301 bootcamp.
- Out-of-scope use cases: Any use beyond an educational example is out-of-scope.
- Data dictionary:
| Name | Modeling Role | Measurement Level | Description |
|---|---|---|---|
| ID | ID | int | unique row indentifier |
| LIMIT_BAL | input | float | amount of previously awarded credit |
| SEX | demographic information | int | 1 = male; 2 = female |
| RACE | demographic information | int | 1 = hispanic; 2 = black; 3 = white; 4 = asian |
| EDUCATION | demographic information | int | 1 = graduate school; 2 = university; 3 = high school; 4 = others |
| MARRIAGE | demographic information | int | 1 = married; 2 = single; 3 = others |
| AGE | demographic information | int | age in years |
| PAY_0, PAY_2 - PAY_6 | inputs | int | history of past payment; PAY_0 = the repayment status in September, 2005; PAY_2 = the repayment status in August, 2005; ...; PAY_6 = the repayment status in April, 2005. The measurement scale for the repayment status is: -1 = pay duly; 1 = payment delay for one month; 2 = payment delay for two months; ...; 8 = payment delay for eight months; 9 = payment delay for nine months and above |
| BILL_AMT1 - BILL_AMT6 | inputs | float | amount of bill statement; BILL_AMNT1 = amount of bill statement in September, 2005; BILL_AMT2 = amount of bill statement in August, 2005; ...; BILL_AMT6 = amount of bill statement in April, 2005 |
| PAY_AMT1 - PAY_AMT6 | inputs | float | amount of previous payment; PAY_AMT1 = amount paid in September, 2005; PAY_AMT2 = amount paid in August, 2005; ...; PAY_AMT6 = amount paid in April, 2005 |
| DELINQ_NEXT | target | int | whether a customer's next payment is delinquent (late), 1 = late; 0 = on-time |
- Source of training data: GWU Blackboard, email
[email protected]for more information - How training data was divided into training and validation data: 50% training, 25% validation, 25% test
- Number of rows in training and validation data:
- Training rows: 15,000
- Validation rows: 7,500
- Source of test data: GWU Blackboard, email
[email protected]for more information - Number of rows in test data: 7,500
- State any differences in columns between training and test data: None
- Columns used as inputs in the final model: 'LIMIT_BAL', 'PAY_0', 'PAY_2', 'PAY_3', 'PAY_4', 'PAY_5', 'PAY_6', 'BILL_AMT1', 'BILL_AMT2', 'BILL_AMT3', 'BILL_AMT4', 'BILL_AMT5', 'BILL_AMT6', 'PAY_AMT1', 'PAY_AMT2', 'PAY_AMT3', 'PAY_AMT4', 'PAY_AMT5', 'PAY_AMT6'
- Column(s) used as target(s) in the final model: 'DELINQ_NEXT'
- Type of model: Decision Tree
- Software used to implement the model: Python, scikit-learn
- Version of the modeling software: 0.22.2.post1
- Hyperparameters or other settings of your model:
DecisionTreeClassifier(ccp_alpha=0.0, class_weight=None, criterion='gini',
                       max_depth=6, max_features=None, max_leaf_nodes=None,
                       min_impurity_decrease=0.0, min_impurity_split=None,
                       min_samples_leaf=1, min_samples_split=2,
                       min_weight_fraction_leaf=0.0, presort='deprecated',
                       random_state=12345, splitter='best')
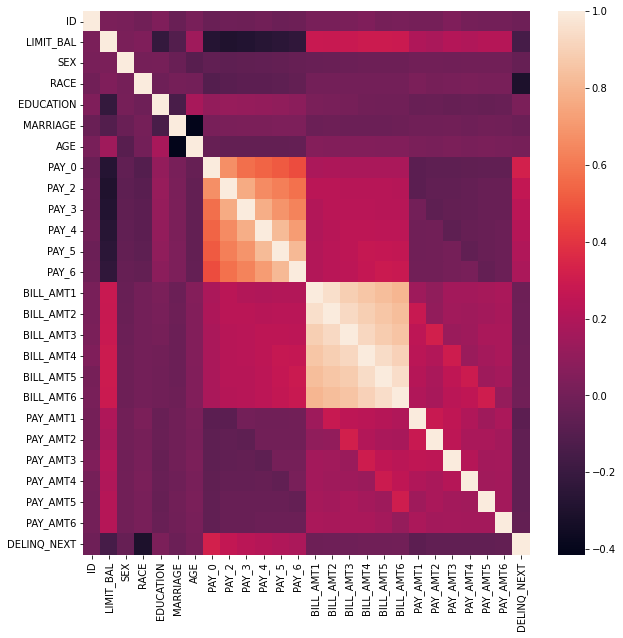
- Correlation Heatmap
Pearson correlation matrix, which shows the correlation between the variables on each axis. Correlation ranges from -1 to +1. Values closer to zero means there is no linear trend between two variables; values closer to +1 means stronger positive correlation; values closer to -1 means stronger negative correlation.And the darker color represents stronger correlation between variables, vice versa.
- Metrics used to evaluate your final model (AUC and AIR)
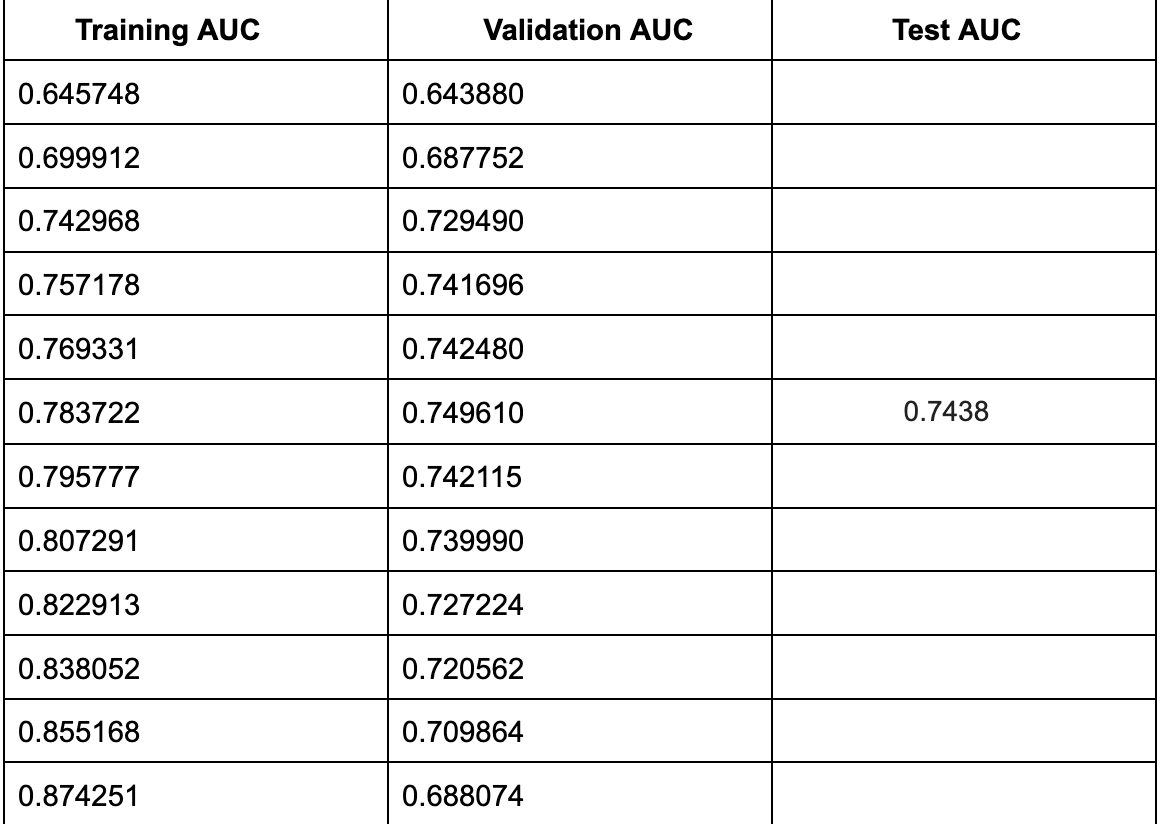
AUC Values
AIR Values
We want to use AIR to evaluate whether there is data discrimination. In the Bias Testing, we found that the value of hispanic-to-white is 0.76, which is less than 0.8. In this case, there is discrimination towards hispanic. So, we need to do the bias remediation to improve the performance of the model. After the remediation, we will get the final AIR Values (See next question).
| Hispanic-to-white AIR | Black-to-white AIR | Asian-to-white AIR | Female-to-male AIR |
|---|---|---|---|
| 0.76 | 0.82 | 1.00 | 1.06 |
- State the final values, neatly -- as bullets or a table, of the metrics for all data: training, validation, and test data
Final AUC Values
| Tr AUC | Val AUC | Test AUC |
|---|---|---|
| 0.7837 | 0.7496 | 0.7438 |
Final AIR Values
| Hispanic-to-white AIR | Black-to-white AIR | Asian-to-white AIR | Female-to-male AIR |
|---|---|---|---|
| 0.83 | 0.85 | 1.00 | 1.02 |
- Provide any plots related to your data or final model -- be sure to label the plots!
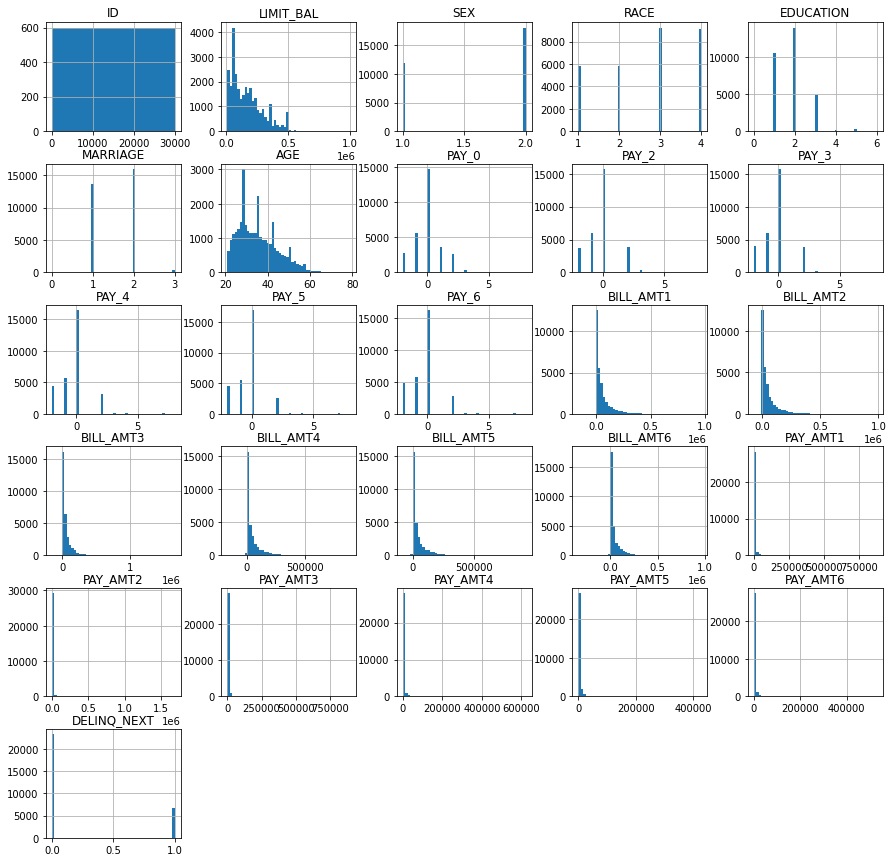
Histograms for each column in the data dictionary
These histograms visualize the data distribution of each variable which clearly show us the insights of features. For example, in the race graph, “1,2,3,4” refer to 4 different race groups, and y axis refers to the number of each race group.
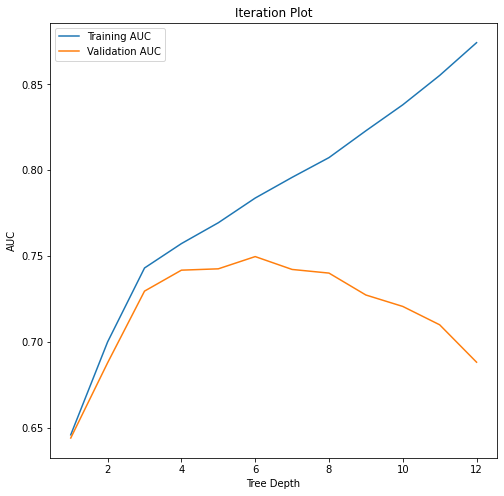
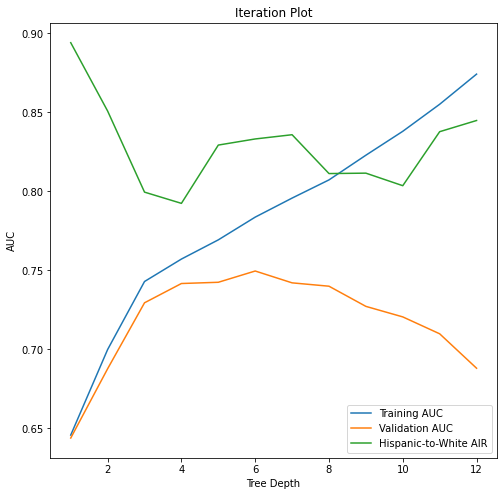
Iteration Plot (tree depth vs. training and validation AUC)
In this plot, AUC refers to how the model would perform in predicting unseen data. We can find that the model with tree depth of 6 has the best performance by analyzing the training AUC and validation AUC.
Decision Tree for human interpretation
We use the best model, which is model 6, to plot the tree with a depth 6.
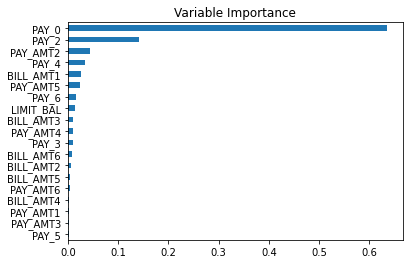
Variable Importance
This plot shows the importance(which was determined by the degree of influence of each variable on the prediction result) of each variable in a descending order. We can see that the variable PAY_0 plays the most important part in determining the eligibility for a credit line increase.
Final Iteration Plot (With Bias Remediation)
In the bias remediation, we redo the model by adding SEX and RACE to get the value hispanic-to-white AIR greater than 0.8. In this plot, we find our final values of training AUC, validation AUC and hispanic-to-white AIR(tree depth = 6).
-
Describe potential negative impacts of using your model:
- Math or software problems
Accuracy. The accuracy of our training model is aroud 70%, there is still almost 40% error. In this case, we may lend money to someone who is not able to pay back.
Lack of data. In our model, we do not have enough data. So, the result we generate will be more random.
- Real-world risks: who, what, when or how
Bias.There is no way to take bias into account when employing a model; the findings are just a metric. A model will inevitably have bias, which could cause it to ignore any important connections between the data inputs and the predictions. The model depends heavily on the status of the immediate payment; depending on the individual's past payment behavior, this could have a negative effect.
-
Describe potential uncertainties relating to the impacts of using your model:
- Math or software problems
Availbility of test data. We are training the test data today, but we are not sure the test data will be available in the future.
- Real-world risks: who, what, when or how?
Security & Privacy. Computers, data, & ML can all be abused to do harm, or be attacked by bad actors. Some hackers may hack into the model and change some personal information to increase his/her eligibility of credit line increase. For example, by using Backdoors exploited with watermarked data, hackers can easily get the results they want.
- Describe any unexpected or results
Missing Data: There is no missing data in our training set, but in the real world, it is highly possible that we will encounter missing data.
