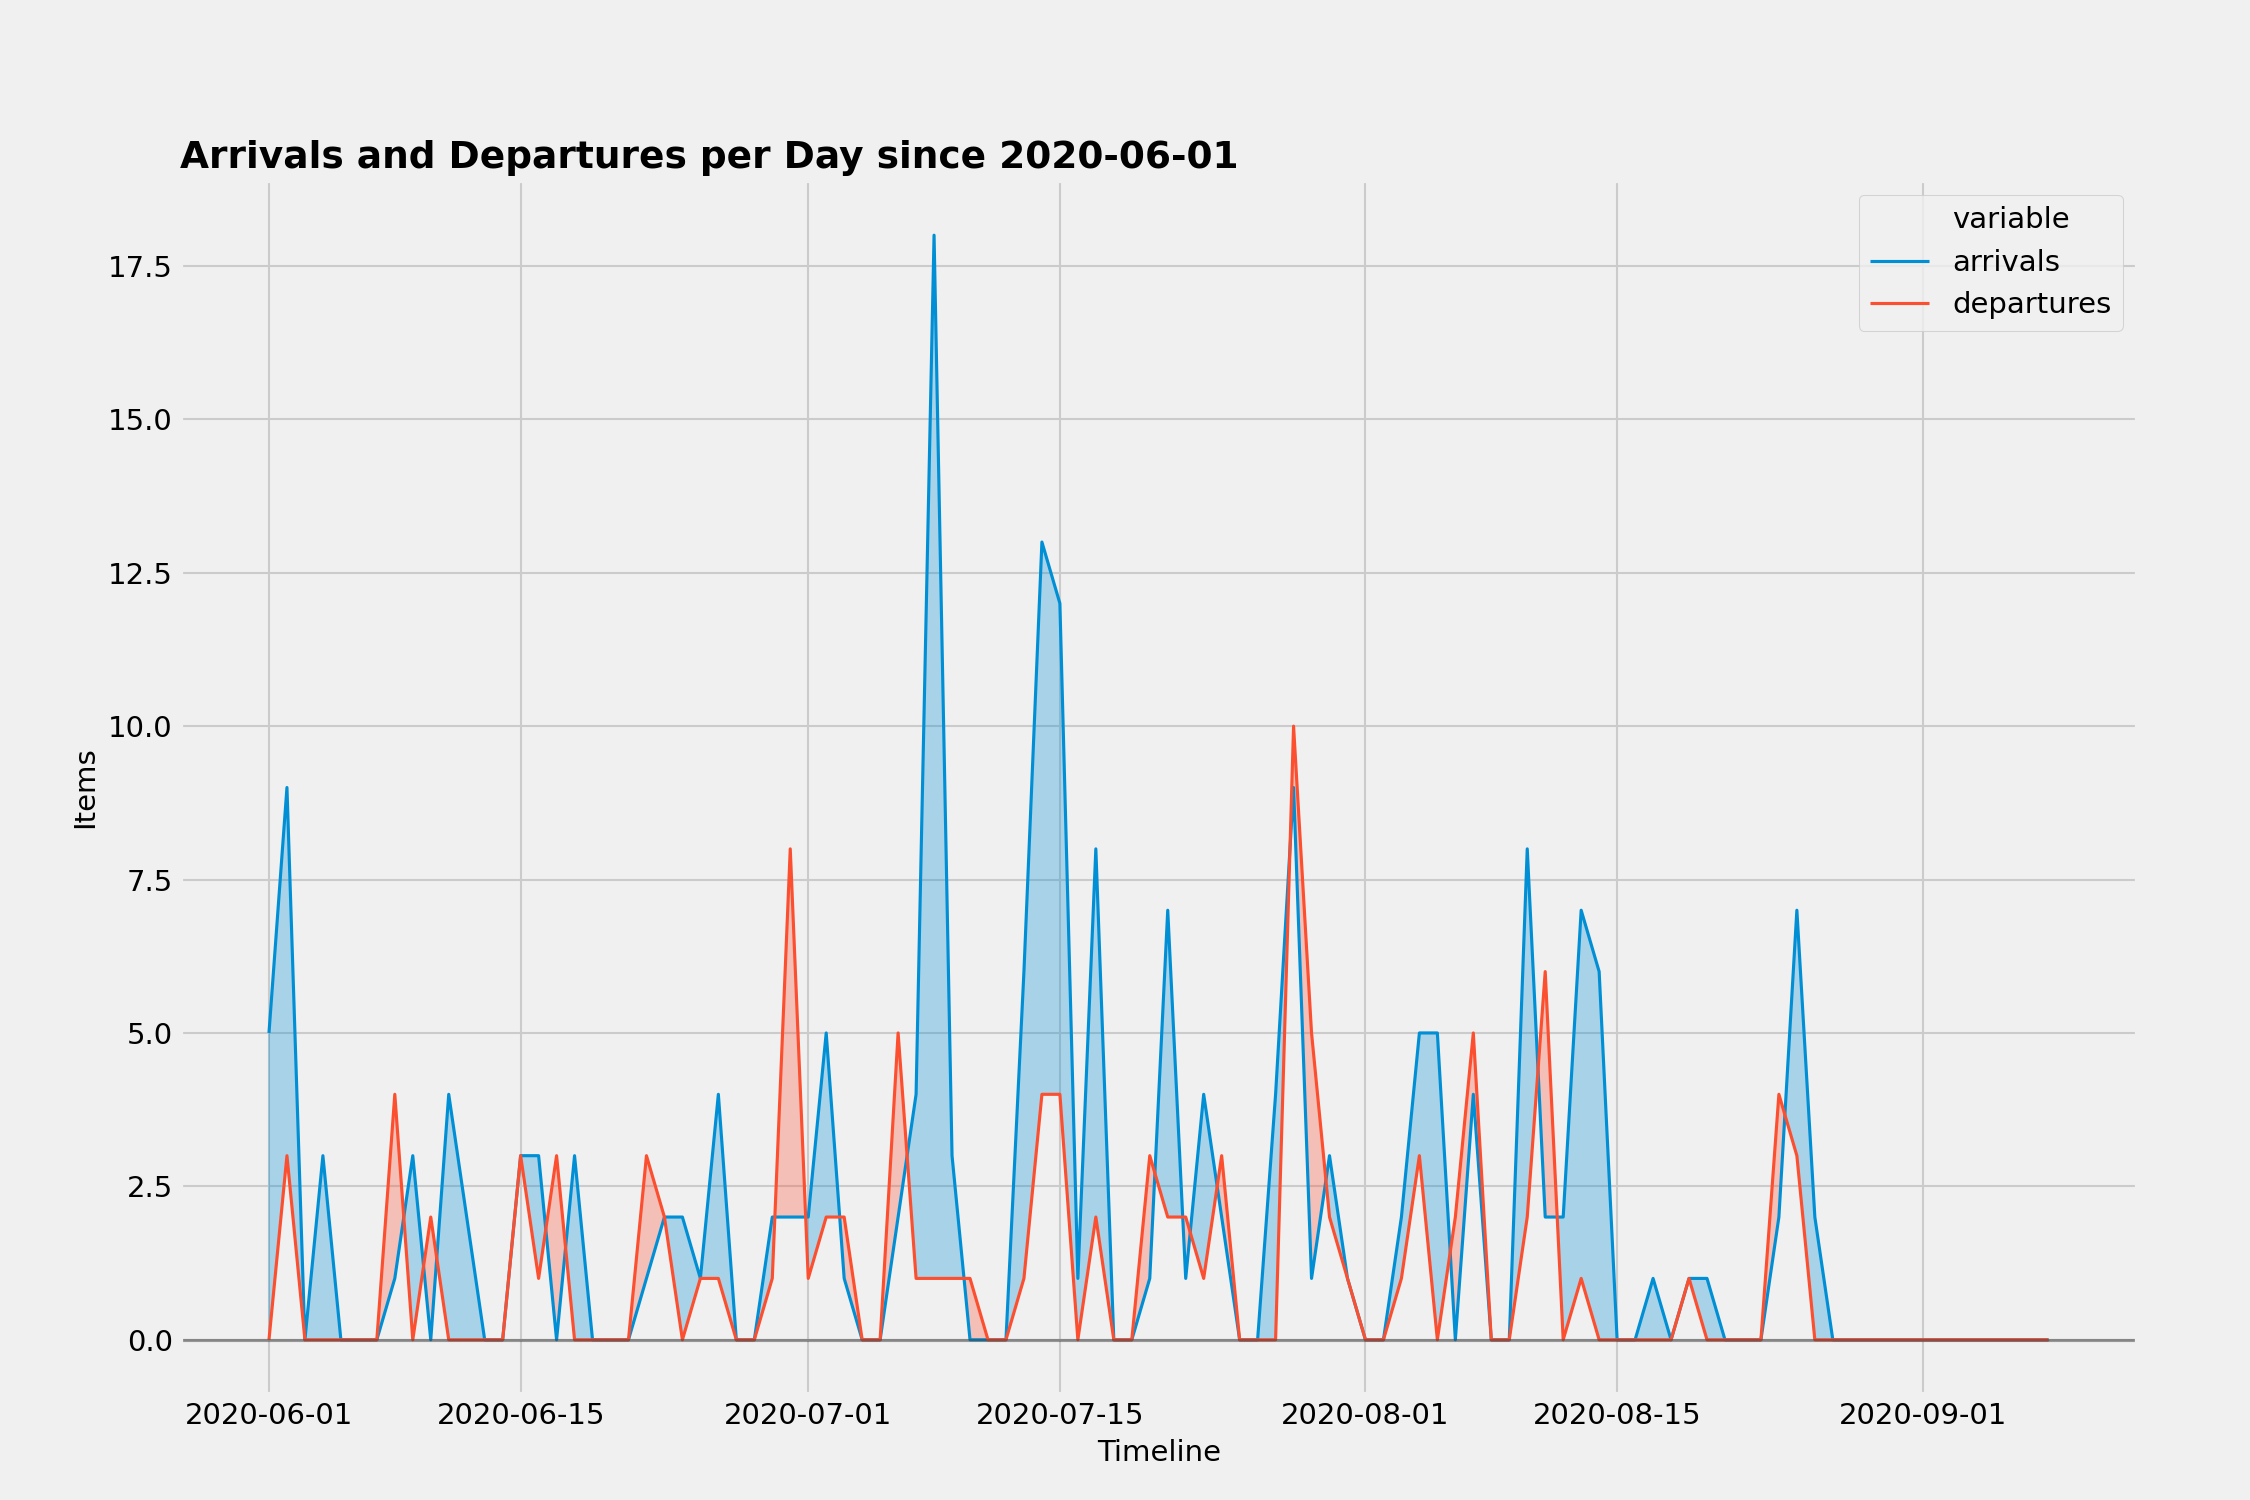
This is an experimental Jupyter notebook and command line tools using Jira issue changelogs to:
- load a historical record of a Kanban
- summarize key Kanban metrics
- graph those key Kanban metrics (cycletime, throughput, flow, etc)
- use these metrics to run a Kaplan-Meier survivability model and a Monte Carlo simulations
This allows us to use data forecasting (instead of gut estimation) to gauge:
- how likely will a single issue be completed in N days
- how much work a team can take on over the next N days
- and by what date N number of work items could be completed
pip install -r requirements.txt
python jira.py [project_key] [since_date]
python analysis.py -f data/data.csv summary
jupyter lab
Generated from an example Jira project and data loaded from example.csv on 2020-08-25 covering the previous 90 days:


