When releasing a new film, it’s a good consideration for stakeholders to investigate how different audiences will respond, especially avid film fans who are more likely to review and share films. Letterboxd is a social network for film reviewers, increasingly popular with critics and movie fans alike with an audience skewed towards young adults, a critical demographic. Letterboxd allows users to rate films from 0 – 5 stars and mark a film as “liked” or “viewed,” valuable insights into the popularity, or controversiality, of a film. When examining the most important features in predicting the average rating of a film on Letterboxd, what can these insights reveal about what stakeholders should consider when marketing and releasing a film?
I used Andres Hernandez’s Letterboxd dataset scraped from the website and available through Kaggle. The data is in CSV format with five files for the genres Animation, Horror, SciFi, Thriller and War. Each file included the features:
Title – title of the film
Year – year the film was released
Director
Running_time in minutes
Views – number of people who have viewed the film on Letterboxd
Likes – number of people who have liked the film on Letterboxd
Avg_rating – average rating of the film given by users on Letterboxd
Half_star, One_star, One_half_star, Two_star, Two_half_star, Three_star, Three_half_star, Four_star, Four_half_star, Five_star – number of people who gave a certain rating to a film useful to see if a film is “controversial,” i.e. has a large number of high and low ratings.
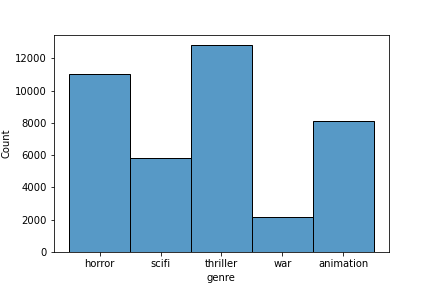
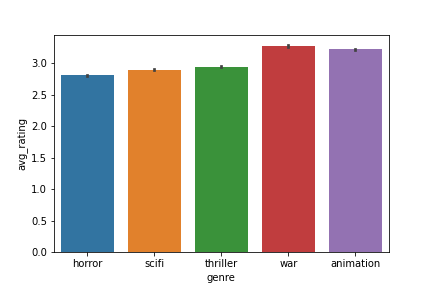
The number of films in each genre varied widely, which explains animation, scifi and war films having a higher number of average ratings.
The data contains some null values in the director and year columns. I chose to fill the missing director values with ‘directorNA’ in order to keep track of the missing values. In terms of the missing year values, I created a new column ‘year_isna’ with Boolean values, and filled the null values with 0.
I also experimented with using the directors variable as a feature by using indicator variables for each unique director, however this resulted in 6000 features which creates a dimensionality problem. The model is only useful on directors it has been trained on, and 6000 unique directors is too many features to add anything meaningful to the model’s predictions.
As part of my experiments, I also trained several models including views and likes with the other features.
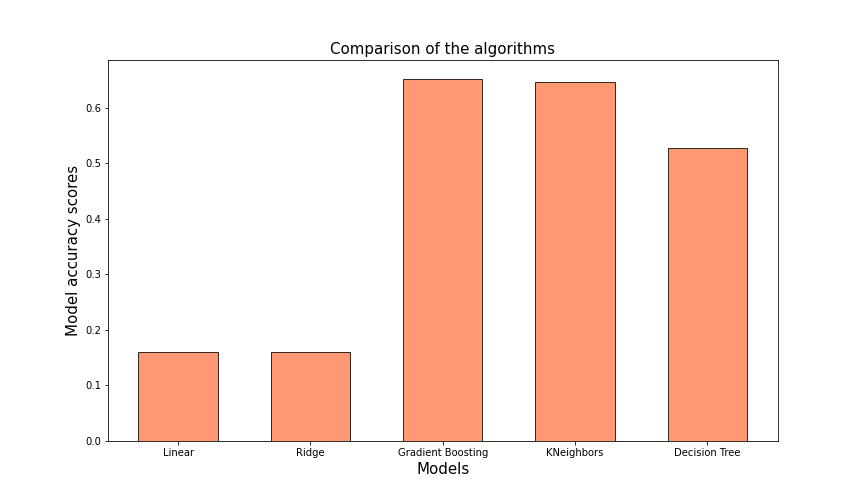
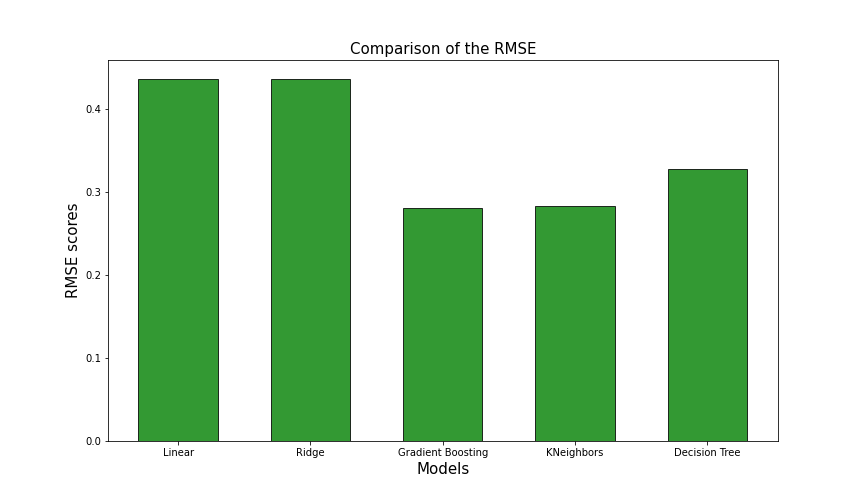
This resulted in the best accuracy of any of the models, with a model score on unseen dating achieving 0.65 accuracy and an RMSE of 0.28 with a Gradient Boosting Regressor and an accuracy of 0.646 with an RMSE of 0.28 for KNeighbors Regressor. Decision Tree beat Linear and Ridge Regression, however it overfit to the data with a training set accuracy of 0.99 and a test set accuracy of only 0.52, lower than Gradient Boosting and KNeighbors Regressor. Below is a comparison of models trained on all the numeric data including views and likes.
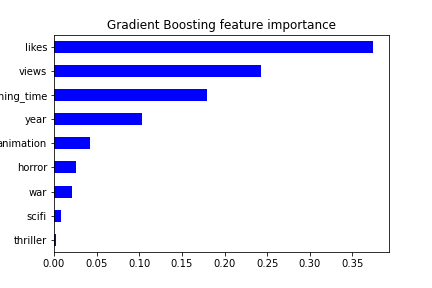
However, these features are giveaway features, as stakeholders would not know the likes and views of their film before it is released. These features are the most important to the Gradient Boosting Regressor because likes and views are highly correlated with higher rated films. While these models have the impressive accuracy for the dataset, these are not useful for the problem at hand. For stakeholders who want to know how to market and release their film, these features are useless as these numbers are difficult to estimate until the film is actually released.
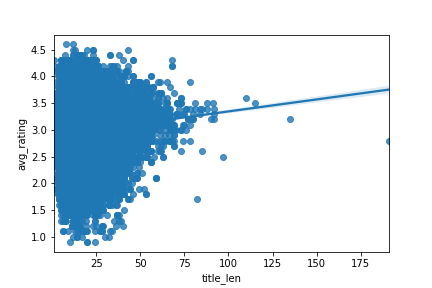
One interesting feature I explored is the length of films’ titles. I used Natural Language Processing techniques to extract the length of characters in each title and created a new feature, title_len. Length is lightly correlated to the average rating and longer titles tend to have slightly higher ratings.
Adding this feature to the existing models improved accuracy.
It might be useful to perform NLP on different features in the movie titles, such as I, II and V to identify sequels. While I didn’t include this type of analysis in my model, it might be useful to consider in future explorations.
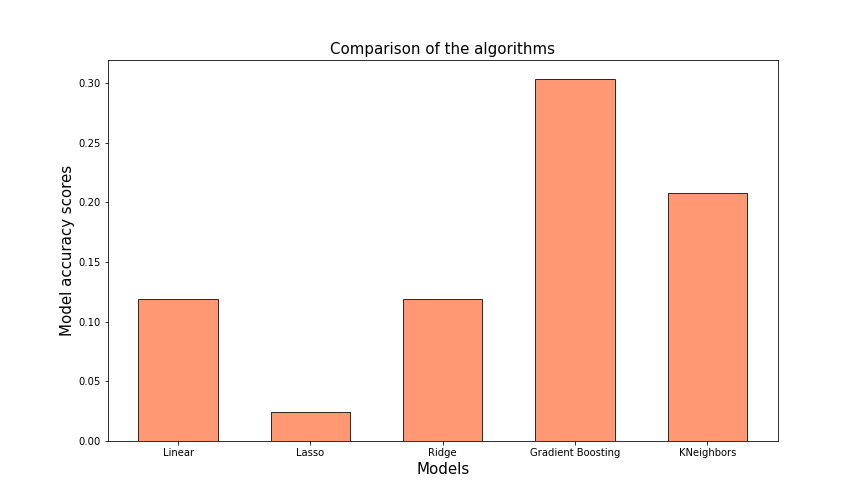
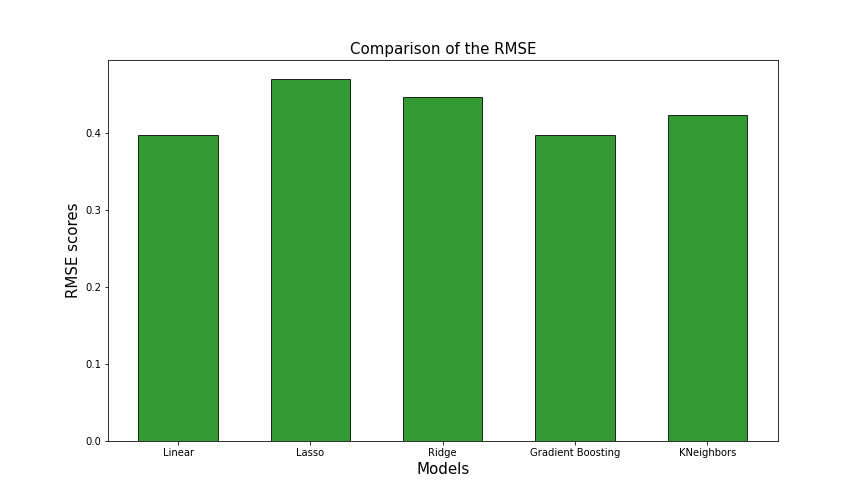
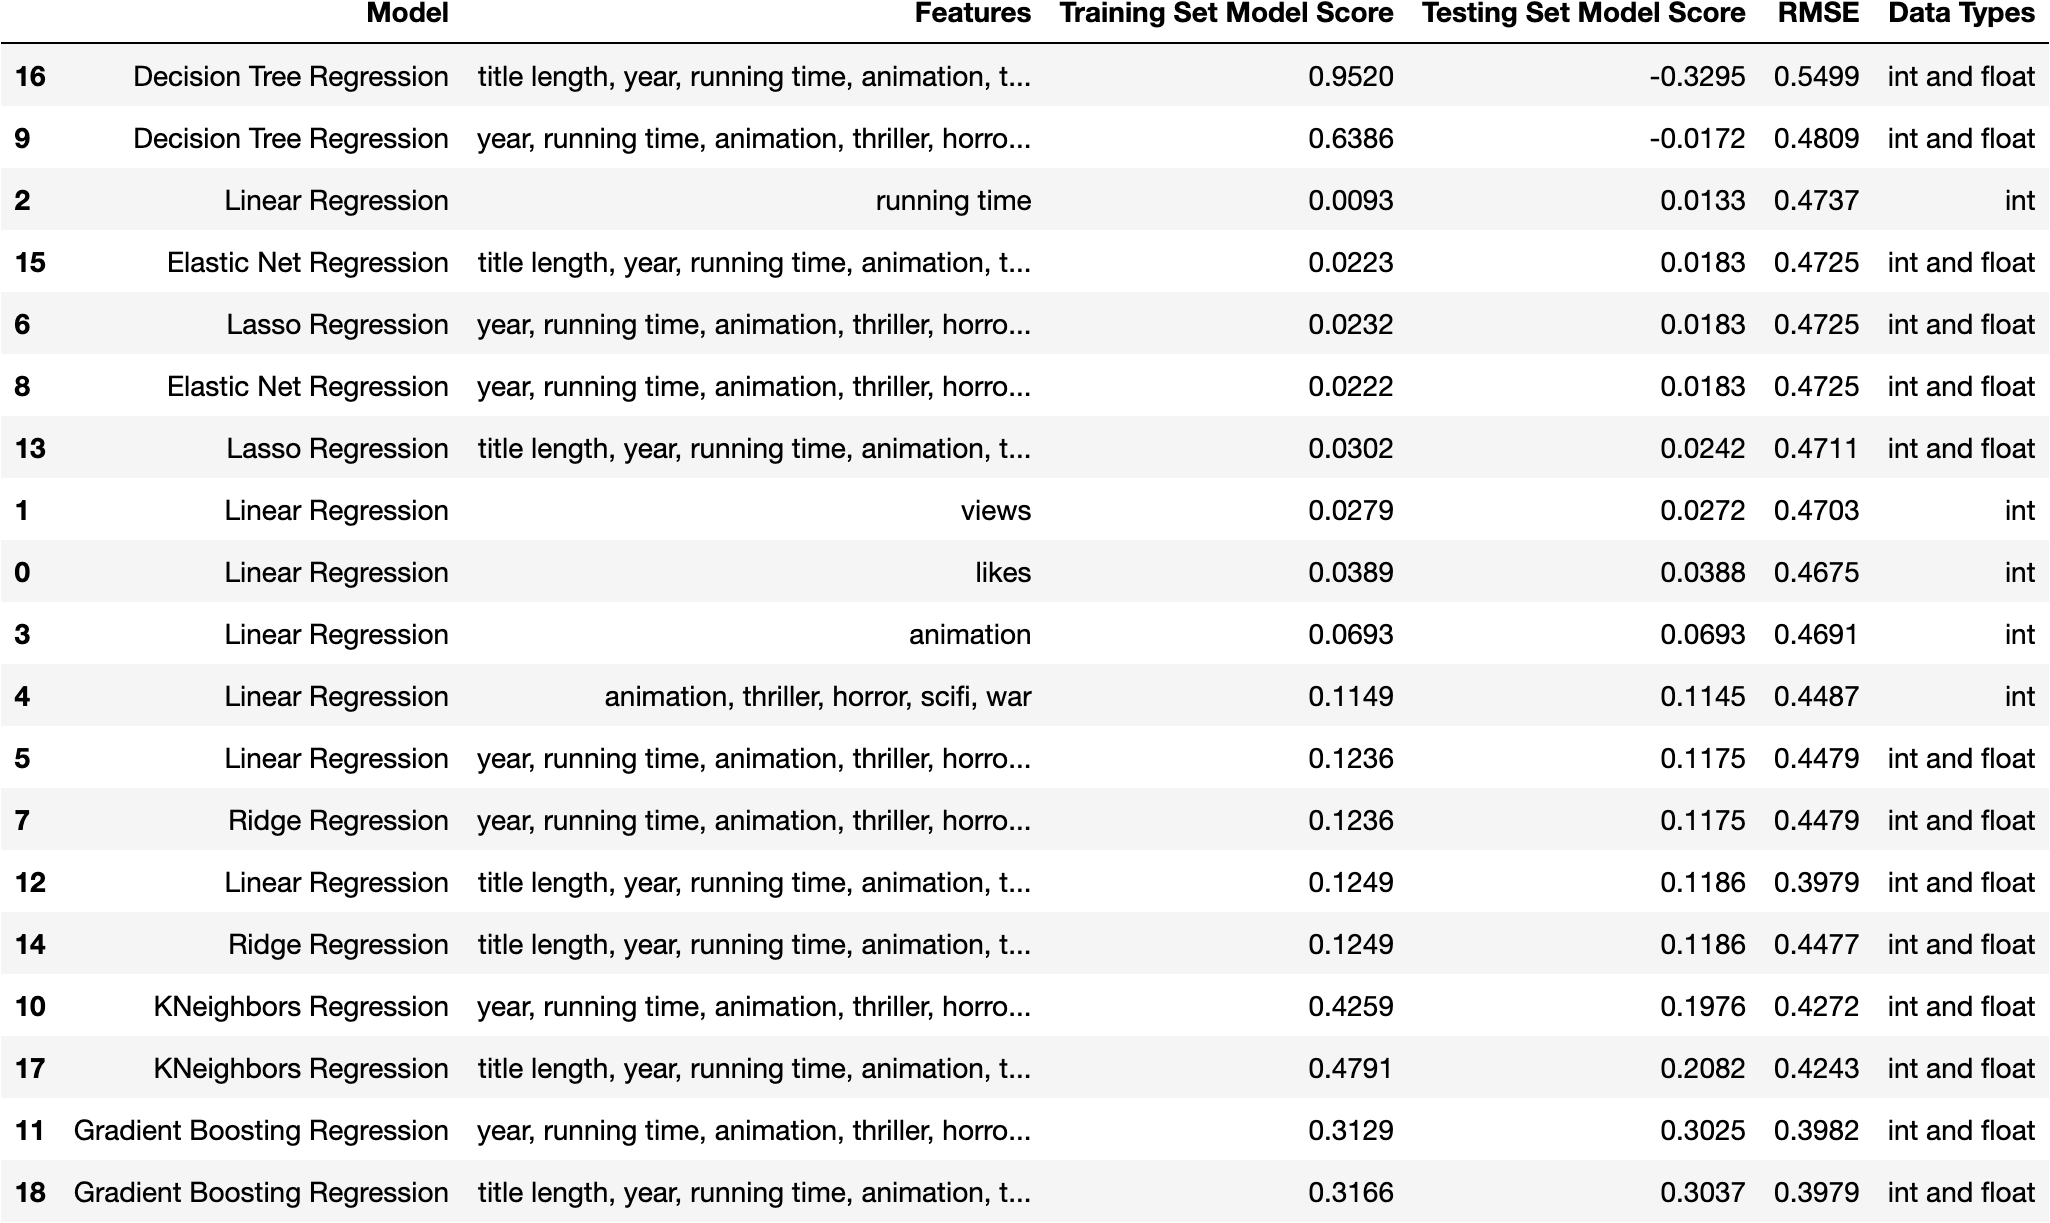
Gradient Boosting Regression with title length in addition to the other numeric features (year, running time, and the indicator variables for the genres) has the best accuracy and RMSE score. The model has the highest accuracy at 0.3037 on unseen test data and an RMSE of 0.3979, and while the prediction rate can’t give a confident average rating for a film yet to be released, the model is useful in examining important features in relation to rating and helping stakeholders make decisions on how to release a film.
The Linear Regression model also proves useful as a simpler model with faster training time that gives insights into how the various features influence the final result.
title_len 0.001826
year -0.000926
running_time 0.000154
animation 0.186528
horror -0.208405
scifi -0.130003
thriller -0.080630
war 0.232510
When comparing the accuracy and RMSE of regression models I tried, Gradient Boosting Regression and KNeighbors Regression models stand out.
While the model isn’t accurate enough to give a confident prediction of an average rating for a film yet to be released, it can be useful for stakeholders interested in what features influence the ratings of their films. While some features like year can’t be changed with the release of a film, considering genre, such as choosing to release a film as a thriller instead of horror.
Stakeholders could also consider the length of the title’s name, as longer titles tend to get slightly higher average ratings.
While all of these features have a relatively small impact on a film’s ratings, anything that could help boost ratings should be taken into consideration. Letterboxd is a valuable resource for gouging the opinions of influential film fans and can reveal interesting trends in taste.
| Model | Features | Training Set Model Score | Testing Set Model Score | RMSE | Data Types |
|---|---|---|---|---|---|
| Linear Regression | likes | 0.0389 | 0.0388 | 0.4675 | int |
| Linear Regression | views | 0.0279 | 0.0272 | 0.4703 | int |
| Linear Regression | running time | 0.0093 | 0.0133 | 0.4737 | int |
| Linear Regression | animation | 0.0693 | 0.0693 | 0.4691 | int |
| Linear Regression | animation, thriller, horror, scifi, war | 0.1149 | 0.1145 | 0.4487 | int |
| Linear Regression | year, running time, animation, thriller, horror, scifi, war | 0.1236 | 0.1175 | 0.4479 | int and float |
| Lasso Regression | year, running time, animation, thriller, horror, scifi, war | 0.0232 | 0.0183 | 0.4725 | int and float |
| Ridge Regression | year, running time, animation, thriller, horror, scifi, war | 0.1236 | 0.1175 | 0.4479 | int and float |
| Elastic Net Regression | year, running time, animation, thriller, horror, scifi, war | 0.0222 | 0.0183 | 0.4725 | int and float |
| Decision Tree Regression | year, running time, animation, thriller, horror, scifi, war | 0.6386 | -0.0172 | 0.4809 | int and float |
| KNeighbors Regression | year, running time, animation, thriller, horror, scifi, war | 0.4259 | 0.1976 | 0.4272 | int and float |
| Gradient Boosting Regression | year, running time, animation, thriller, horror, scifi, war | 0.3129 | 0.3025 | 0.3982 | int and float |
| Linear Regression | title length, year, running time, animation, thriller, horror, scifi, war | 0.1249 | 0.1186 | 0.3979 | int and float |
| Lasso Regression | title length, year, running time, animation, thriller, horror, scifi, war | 0.0302 | 0.0242 | 0.4711 | int and float |
| Ridge Regression | title length, year, running time, animation, thriller, horror, scifi, war | 0.1249 | 0.1186 | 0.4477 | int and float |
| Elastic Net Regression | title length, year, running time, animation, thriller, horror, scifi, war | 0.0223 | 0.0183 | 0.4725 | int and float |
| Decision Tree Regression | title length, year, running time, animation, thriller, horror, scifi, war | 0.9520 | -0.3295 | 0.5499 | int and float |
| KNeighbors Regression | title length, year, running time, animation, thriller, horror, scifi, war | 0.4791 | 0.2082 | 0.4243 | int and float |
| Gradient Boosting Regression | title length, year, running time, animation, thriller, horror, scifi, war | 0.3166 | 0.3037 | 0.3979 | int and float |
CONCLUSIONS
Gradient Boosting Regression, KNeighbors Regression and Linear Regression provide the most accurate predictions on unseen data. Gradient Boosting gives the lowest RMSE (0.3979) and the highest model accuracy score on the testing set (0.3166).
