Game development tools for working with Godot Engine in Visual Studio Code.
IMPORTANT NOTE: Versions 1.0.0 and later of this extension only support Godot 3.2 or later.
- Godot Tools
- Features
- Download
- Commands
- Configuration - Godot Editor - VS Code
- GDScript Debugger - Configurations
- Contributing
(bold items are new in Godot Tools v2.0.0)
- ALL FEATURES FULLY SUPPORT GODOT 4
- GDScript (
.gd) language features:- syntax highlighting
ctrl+clickon any symbol to jump to its definition or open its documentationctrl+clickonres://resource/pathlinks- hover previews on
res://resource/pathlinks - builtin code formatter
- autocompletions
- full typed GDScript support
- optional "Smart Mode" to improve productivity with dynamically typed scripts
- Hover previews show function/variable definitions including doc-comments
- switch from a
.gdfile to the related.tscnfile (default keybind isalt+o) - display script warnings and errors
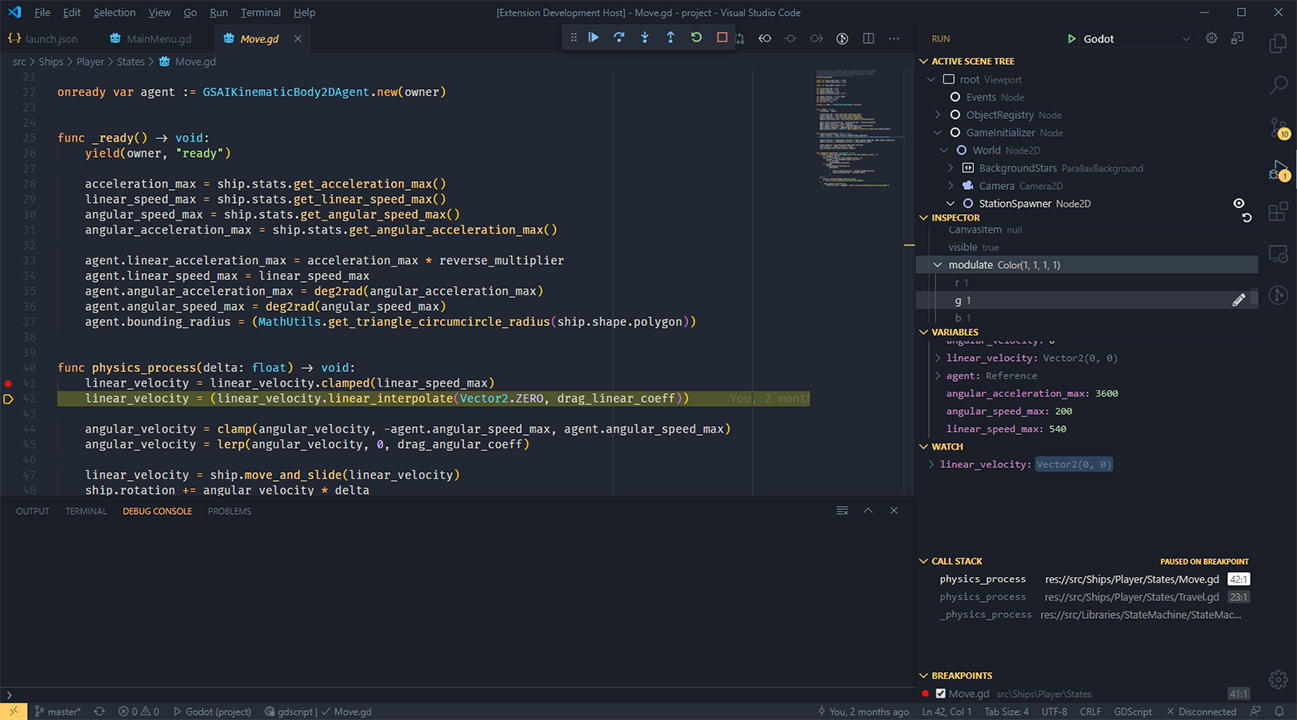
- GDScript Debugger features:
- completely rewritten, greatly improved reliability
- new, simple configuration (seriously, just hit F5!)
- convenient launch targets: current project/current file/pinned file,
- breakpoints
- exceptions
- step-in/out/over
- variable watch
- call stack
- active scene tree
- inspector
- GDResource (
.tscnand.tres) language features:- syntax highlighting
ctrl+clickonres://resource/pathlinksctrl+clickon symbols to jump to its definition or open its documentation- hover previews show definitions of External and Sub Resources
- hover previews on
res://resource/pathlinks - inlay hints to help visualize External and Sub Resources
- in-editor Scene Preview
- GDShader (
.gdshader) language features:- syntax highlighting
- Visual Studio Marketplace (recommended)
- Stable release, with support for automatic updates.
- GitHub Releases
- Stable release, but no automatic updates. Can be useful if you need to install an older version of the extension.
- Development build (follows the
masterbranch)- Development build. Contains new features and fixes not available in stable releases, but may be unstable.
- Extract the ZIP archive before installing (it contains the
.vsixfile inside).
To install from GitHub Releases or a development build, see Install from a VSIX in the Visual Studio Code documentation.
The extension adds a few entries to the VS Code Command Palette under "Godot Tools":
- Open workspace with Godot editor
- List Godot's native classes (and open thier documentation)
- Debug the current
.tscn/.gdfile - Debug the pinned
.tscn/.gdfile - Pin/Unpin the current
.tscn/.gdfile for debugging - Open the pinned file
You can set VS Code as your default script editor for Godot by following these steps:
- Open the Editor Settings
- Select Text Editor > External
- Check Use External Editor
- Fill Exec Path with the path to your VS Code executable
- On macOS, this executable is typically located at:
/Applications/Visual Studio Code.app/Contents/MacOS/Electron
- On macOS, this executable is typically located at:
- Fill Exec Flags with
{project} --goto {file}:{line}:{col}
You can use the following settings to configure Godot Tools:
godotTools.editorPath.godot3godotTools.editorPath.godot4
The path to the Godot editor executable. Under Mac OS, this is the executable inside of Godot.app.
godotTools.lsp.headless
When using Godot >3.6 or >4.2, Headless LSP mode is available. In Headless mode, the extension will attempt to launch a windowless instance of the Godot editor to use as its Language Server.
The debugger is for GDScript projects. To debug C# projects, use C# Tools for Godot.
To configure the GDScript debugger:
- Open the command palette (by pressing F1):
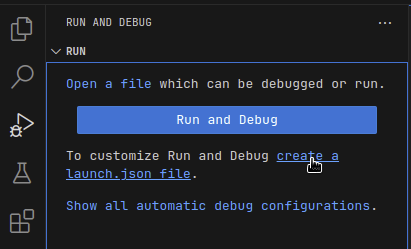
>View: Show Run and Debug- Click on "create a launch.json file"
- Select the Debug Godot configuration.
- Change any relevant settings.
- Press F5 to launch.
Minimal:
{
	"name": "Launch",
	"type": "godot",
	"request": "launch"
}
Everything:
{
	"name": "Launch",
	"type": "godot",
	"request": "launch",
	"project": "${workspaceFolder}",
	"address": "127.0.0.1",
	"port": 6007,
	"scene": "main|current|pinned|<path>",
	"editor_path": "<path>",
	// engine command line flags
	"profiling": false,
	"single_threaded_scene": false,
	"debug_collisions": false,
	"debug_paths": false,
	"debug_navigation": false,
	"debug_avoidance": false,
	"debug_stringnames": false,
	"frame_delay": 0,
	"time_scale": 1.0,
	"disable_vsync": false,
	"fixed_fps": 60,
	// anything else
	"additional_options": ""
}
Godot's command flags are documented here: https://docs.godotengine.org/en/stable/tutorials/editor/command_line_tutorial.html
Usage
- Stacktrace and variable dumps are the same as any regular debugger
- The active scene tree can be refreshed with the Refresh icon in the top right.
- Nodes can be brought to the fore in the Inspector by clicking the Eye icon next to nodes in the active scene tree, or Objects in the inspector.
- You can edit integers, floats, strings, and booleans within the inspector by clicking the pencil icon next to each.
The Godot Tools extension is an open source project from the Godot organization. Feel free to open issues and create pull requests anytime.
See the full changelog for the latest changes.
see CONTRIBUTING.md
- Godot 3.2 or later is required.
- Make sure the Godot editor is running
- Make sure to open the project in the Godot editor first. If you opened the editor after opening VS Code, you can click the Retry button in the bottom-right corner in VS Code.
- GDScript is a dynamically typed script language. The language server can't infer all variable types.
- To increase the number of results displayed, open the Editor Settings, go to the Language Server section then check Enable Smart Resolve.

