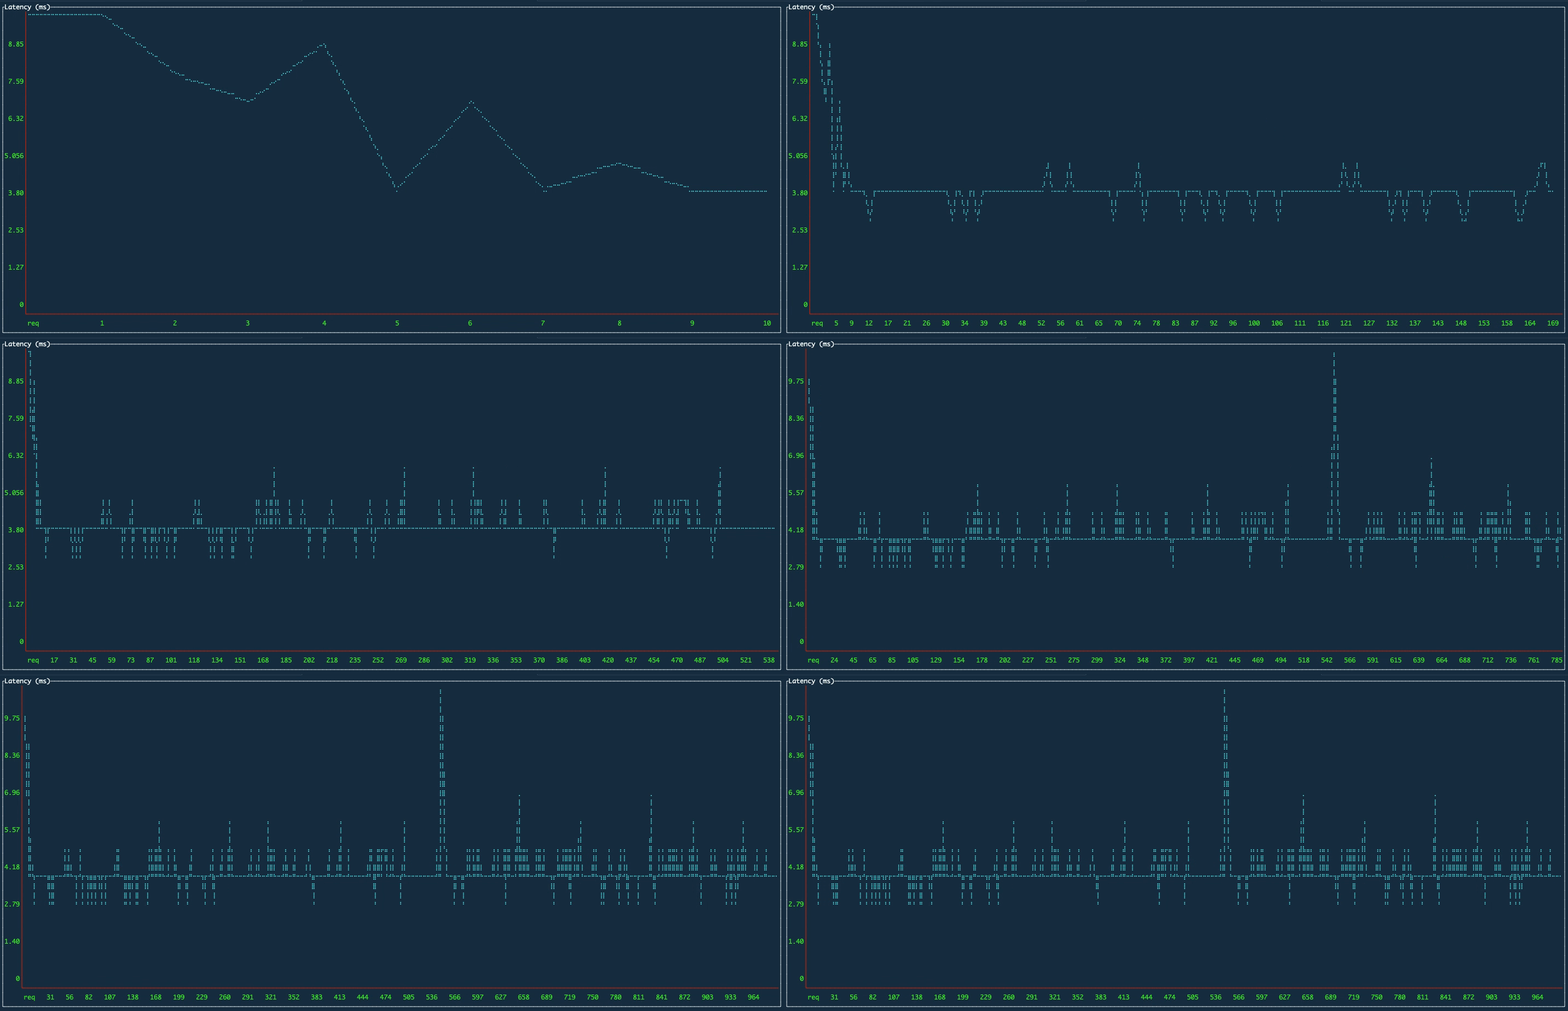
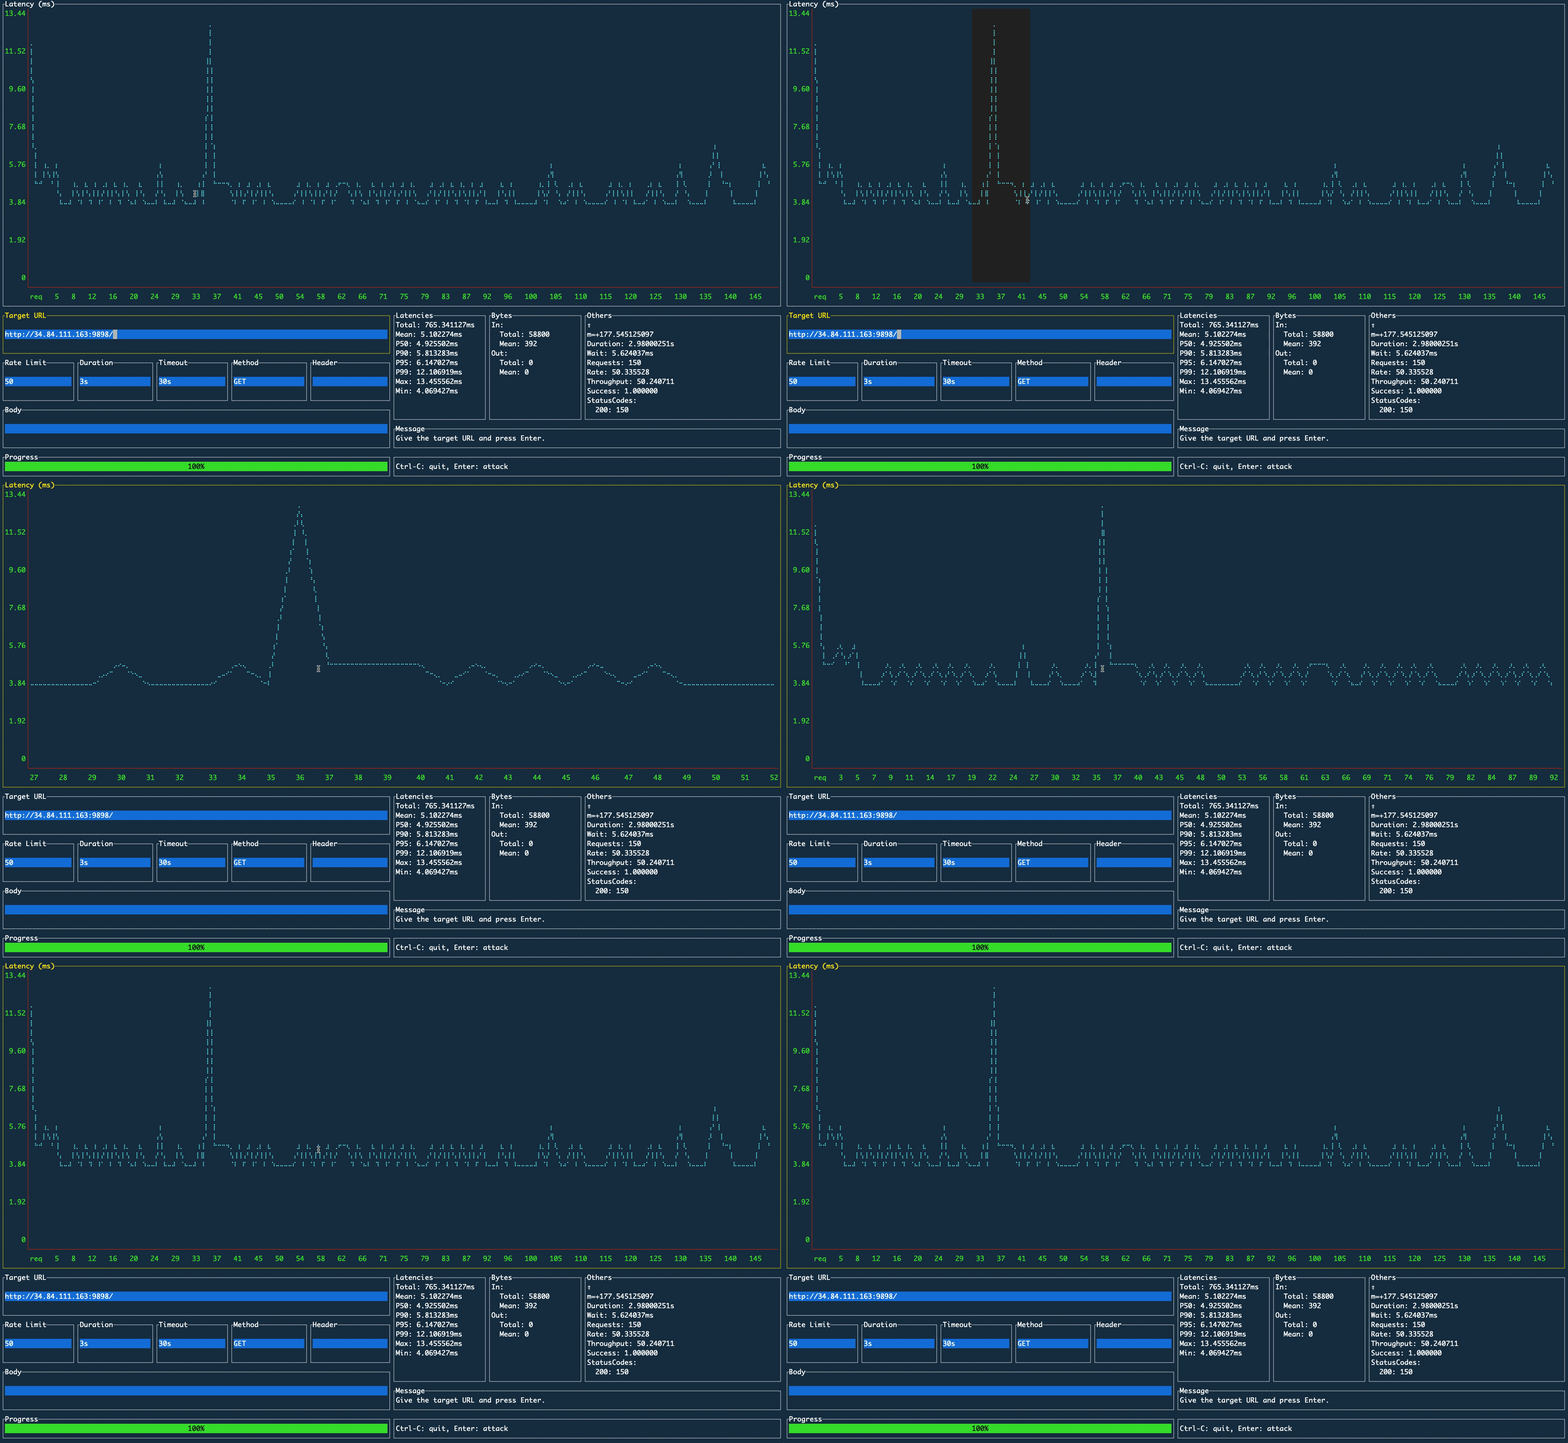
A load testing tool aimed to perform real-time analysis, inspired by vegeta and jplot.
ali comes with a terminal-based UI where you can plot the metrics in real-time, so lets you perform real-time analysis on the terminal.
Binaries are available through the releases page.
Via Homebrew
brew install nakabonne/ali/aliVia APT
wget https://github.com/nakabonne/ali/releases/download/v0.2.5/ali_0.2.5_linux_amd64.deb
apt install ./ali_0.2.5_linux_amd64.deb
Via RPM
curl -OL https://github.com/nakabonne/ali/releases/download/v0.2.5/ali_0.2.5_linux_amd64.rpm
rpm -i ./ali_0.2.5_linux_amd64.rpm
Via AUR
Thanks to orhun, it's available as ali in the Arch User Repository.
yay -S aliVia Go
go get github.com/nakabonne/aliVia Docker
docker run --rm -it nakabonne/ali ali$ ali
Click on the target URL input field, give the URL and press Enter. Then the attack will be launched with default options.
Note that UI field-based configuration is planned to eliminated and will only support configuration through CLI flags.
| Name | Description | Default |
|---|---|---|
| Rate Limit | The request rate per second to issue against the targets. Give 0 then it will send requests as fast as possible. | 50 |
| Duration | The amount of time to issue requests to the targets. Give 0s for an infinite attack. Press Ctrl-C to stop. Valid time units are "ns", "us" (or "µs"), "ms", "s", "m", "h". |
10s |
| Timeout | The timeout for each request. 0s means to disable timeouts. Valid time units are "ns", "us" (or "µs"), "ms", "s", "m", "h". |
30s |
| Method | An HTTP request method for each request. | GET |
| Header | A request header to be sent. | empty |
| Body | The file whose content will be set as the http request body. | empty |
Currently it only plots latencies, but in the near future more metrics will be drawn as well.
This will help you during long tests.
With the help of mum4k/termdash, it's intuitive to operate.


