Setup a Kubernetes Developer Cluster using
kindrunning in GitHub Codespaces
GitHub Codespaces is currently in preview
- An invitation will be sent to you during the live Spark session
- You must have a GitHub ID with 2FA enabled
- You must accept the invitation
- via the email link
- via https://github.com/asb-spark
- You will have access to Codespaces on the repo until August 1
- If you have
dotfilesthat use zsh, please use bash for the Spark live event- If you use zsh after the live event, we LOVE PRs
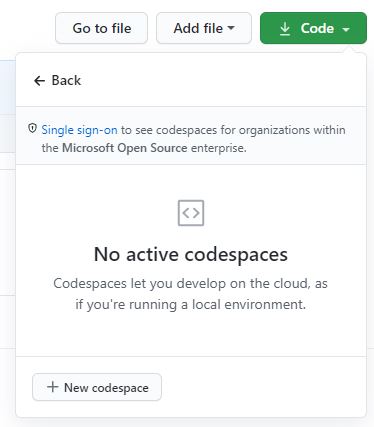
- Click the
Codebutton on your repo - Click
Open with Codespaces - Click
New Codespace - Choose the
4 core option
- When prompted, choose
Open Workspace
make all
Output from make all should resemble this
default      fluentb                                   1/1   Running   0   31s
default      jumpbox                                   1/1   Running   0   25s
default      webv                                      1/1   Running   0   31s
default      ngsa-memory                               1/1   Running   0   33s
monitoring   grafana-64f7dbcf96-cfmtd                  1/1   Running   0   32s
monitoring   prometheus-deployment-67cbf97f84-tjxm7    1/1   Running   0   32s
- All endpoints are usable in your browser via clicking on the
Ports (4)tab- Select the
open in browser iconon the far right
- Select the
- Some popup blockers block the new browser tab
- If you get a gateway error, just hit refresh - it will clear once the port-forward is ready
# check endpoints
make check
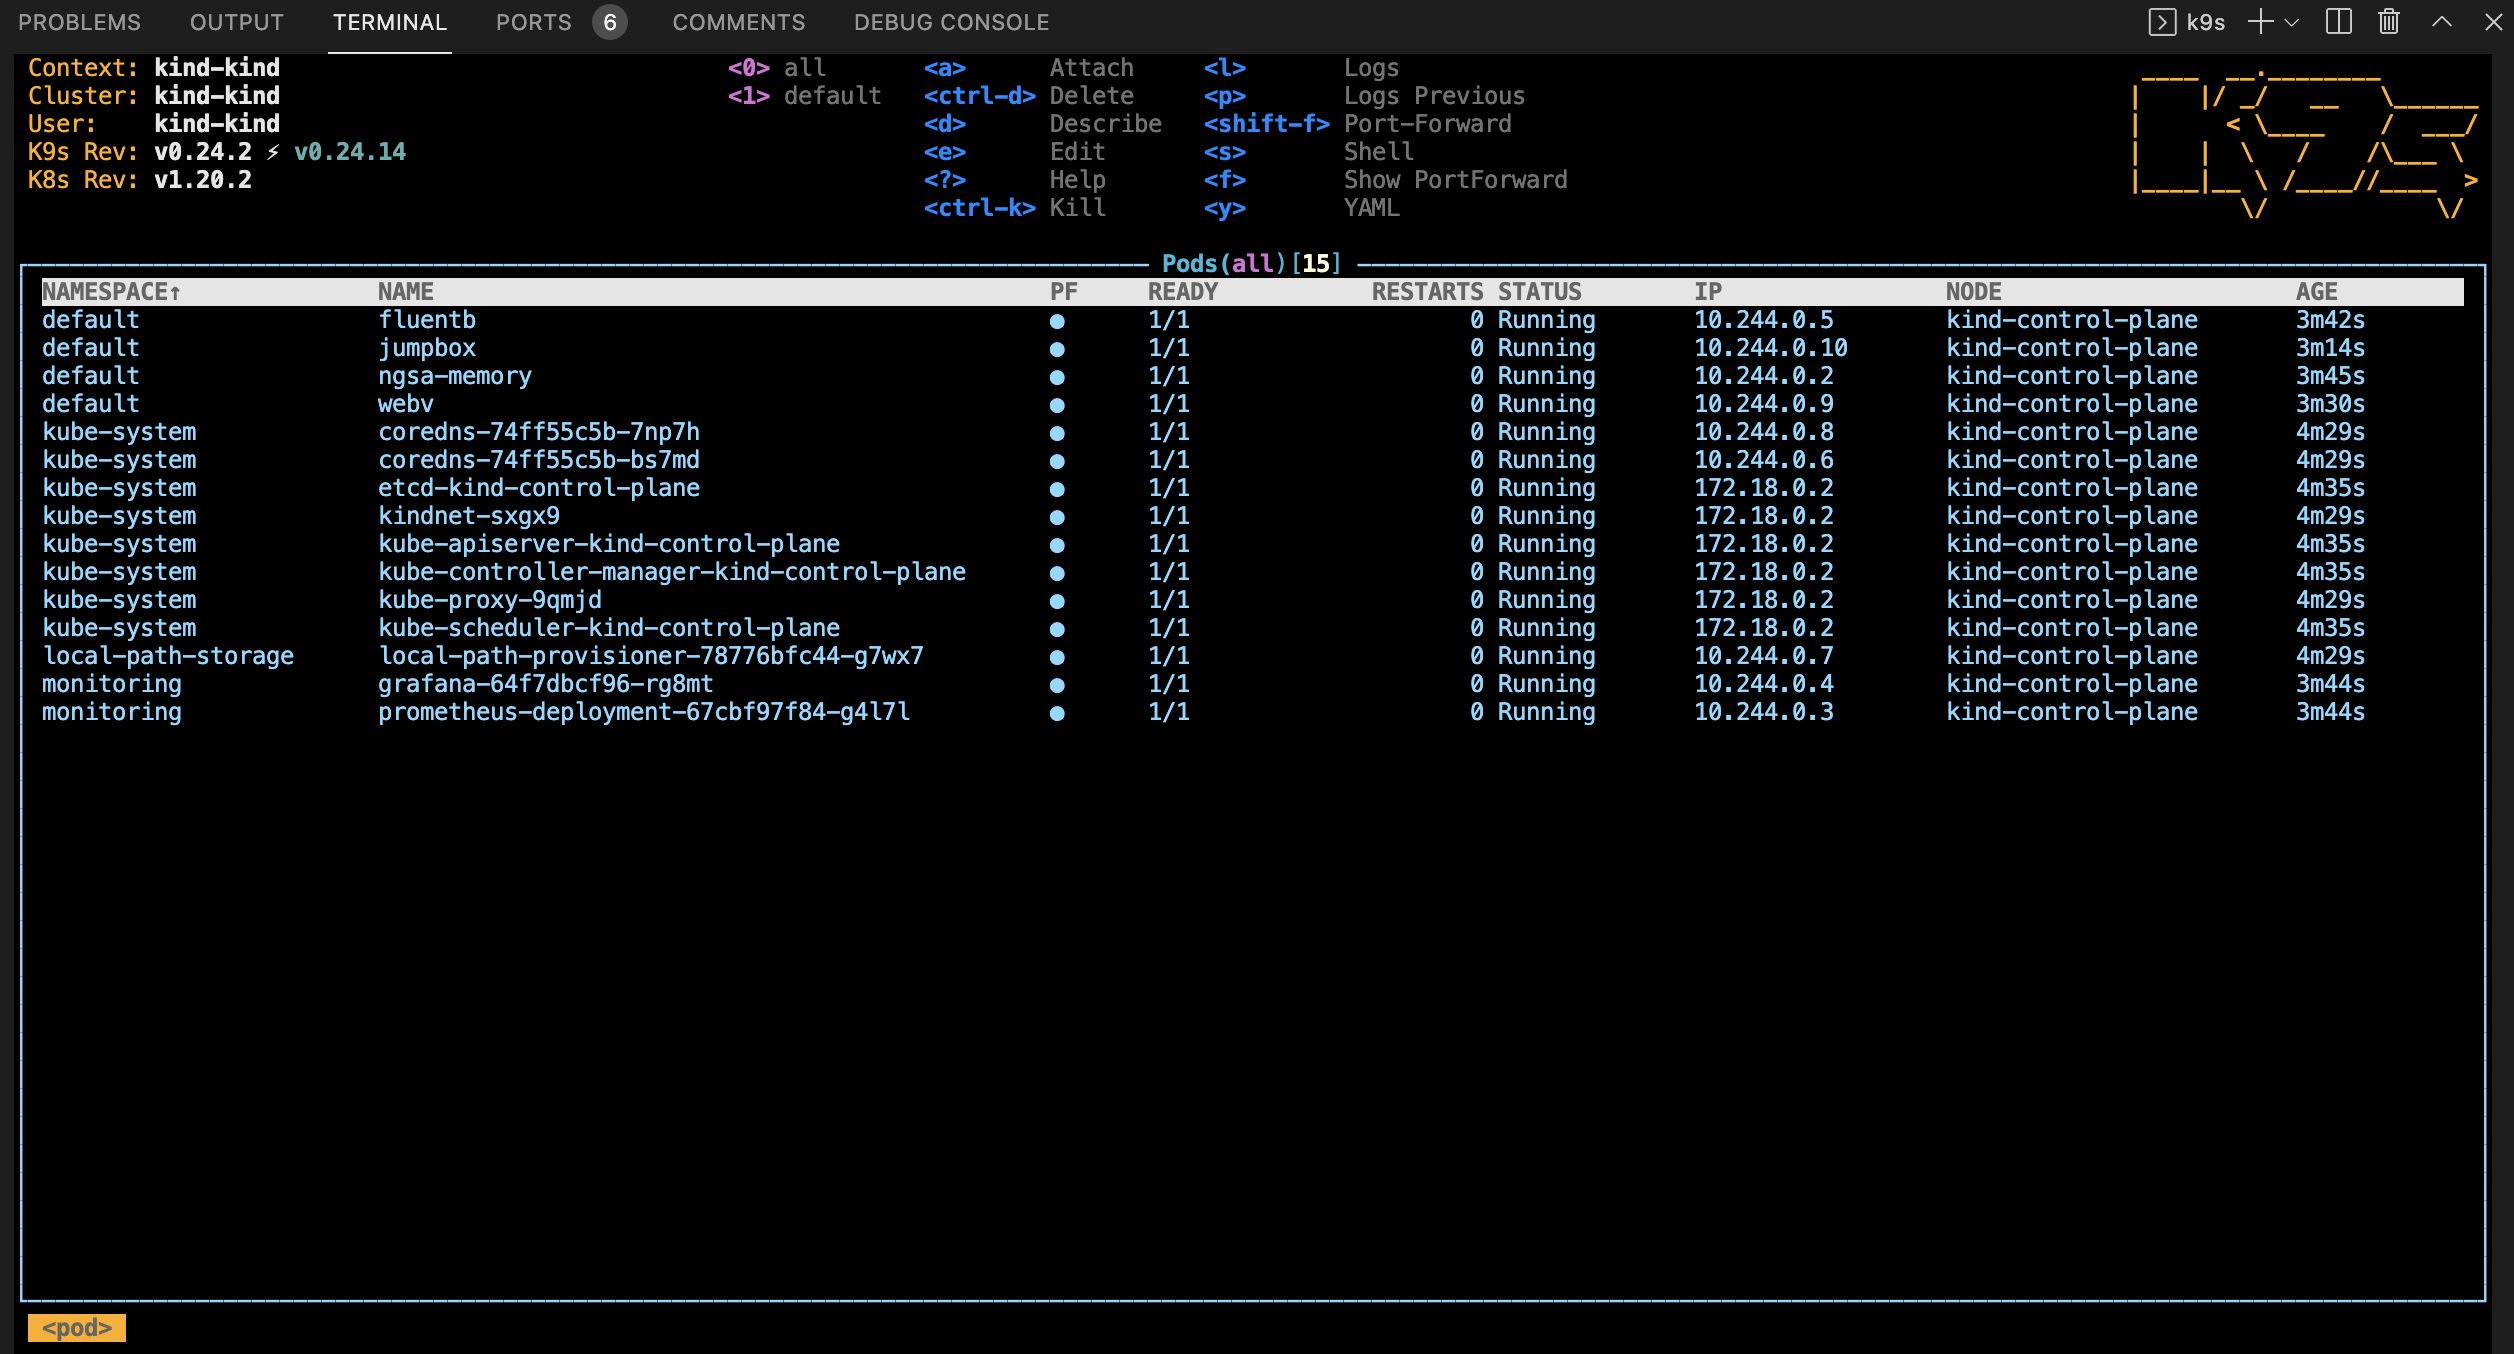
- From the Codespace terminal window, start
k9s- Type
k9sand press enter - Press
0to select all namespaces - Wait for all pods to be in the
Runningstate (look for theSTATUScolumn) - Use the arrow key to select
nsga-memorythen press thelkey to view logs from the pod - To go back, press the
esckey - To view other deployed resources - press
shift + :followed by the deployment type (e.g.secret,services,deployment, etc). - To exit -
:q <enter>
- Type
Open curl.http
curl.http is used in conjuction with the Visual Studio Code REST Client extension.
When you open curl.http, you should see a clickable
Send Requesttext above each of the URLs
Clicking on Send Request should open a new panel in Visual Studio Code with the response from that request like so:
A jump box pod is created so that you can execute commands in the cluster
-
use the
kjaliaskubectl exec -it jumpbox -- bash -l- note: -l causes a login and processes
.profile - note:
sh -lwill work, but the results will not be displayed in the terminal due to a bug
- note: -l causes a login and processes
-
use the
kjealiaskubectl exec -it jumpbox --
-
example
- run http against the ClusterIP
kje http ngsa-memory:8080/version
- run http against the ClusterIP
-
Click on the
portstab of the terminal window -
Click on the
open in browser iconon the Prometheus port (30000) -
This will open Prometheus in a new browser tab
-
From the Prometheus tab
- Begin typing NgsaAppDuration_bucket in the
Expressionsearch - Click
Execute - This will display the
histogramthat Grafana uses for the charts
- Begin typing NgsaAppDuration_bucket in the
-
Grafana login info
- admin
- akdc-512
-
Once
make allcompletes successfully- Click on the
portstab of the terminal window - Click on the
open in browser iconon the Grafana port (32000) - This will open Grafana in a new browser tab
- Click on the
- Click on
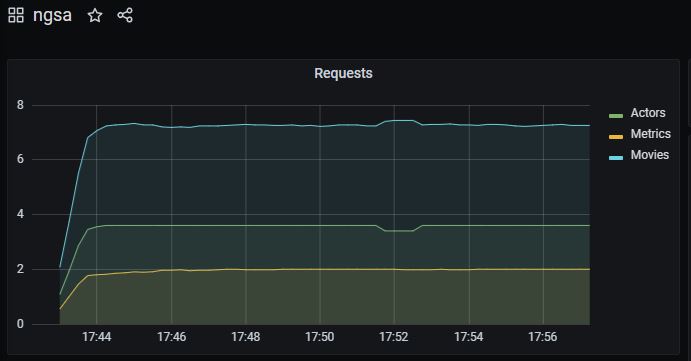
Homeat the top of the page - From the dashboards page, click on
NGSA
# from Codespaces terminal

# run a baseline test (will generate warnings in Grafana)
make test

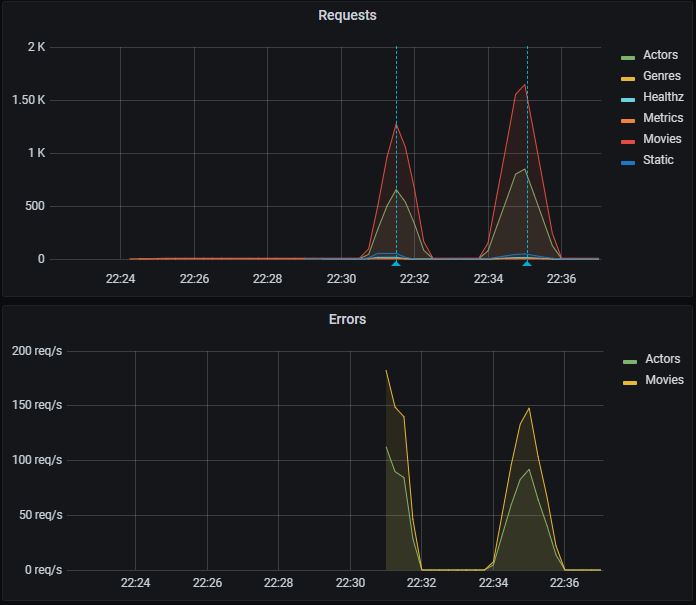
# run a 60 second load test
make load-test
- Switch to the Grafana brower tab
- The test will generate 400 / 404 results
- The requests metric will go from green to yellow to red as load increases
- It may skip yellow
- As the test completes
- The metric will go back to green (1.0)
- The request graph will return to normal
- Start
k9sfrom the Codespace terminal - Select
fluentband pressenter - Press
enteragain to see the logs - Press
sto Toggle AutoScroll - Press
wto Toggle Wrap - Review logs that will be sent to Log Analytics when configured
- Switch back to your Codespaces tab
# from Codespaces terminal

# make and deploy a local version of WebV to k8s
make webv
- Switch back to your Codespaces tab
# from Codespaces terminal

# make and deploy a local version of ngsa-memory to k8s
make app
Makefile is a good place to start exploring
- Why don't we use helm to deploy Kubernetes manifests?
- The target audience for this repository is app developers who are beginning their Kubernetes journey so we chose simplicity for the Developer Experience.
- In our daily work, we use Helm for deployments and it is installed in the
.devcontainershould you want to use it.
- Team Working Agreement
- Team Engineering Practices
- CSE Engineering Fundamentals Playbook
This project uses GitHub Issues to track bugs and feature requests. Please search the existing issues before filing new issues to avoid duplicates. For new issues, file your bug or feature request as a new issue.
For help and questions about using this project, please open a GitHub issue.
This project welcomes contributions and suggestions. Most contributions require you to agree to a Contributor License Agreement (CLA) declaring that you have the right to, and actually do, grant us the rights to use your contribution. For details, visit https://cla.opensource.microsoft.com
When you submit a pull request, a CLA bot will automatically determine whether you need to provide a CLA and decorate the PR appropriately (e.g., status check, comment). Simply follow the instructions provided by the bot. You will only need to do this once across all repos using our CLA.
This project has adopted the Microsoft Open Source Code of Conduct. For more information see the Code of Conduct FAQ or contact [email protected] with any additional questions or comments.
This project may contain trademarks or logos for projects, products, or services.
Authorized use of Microsoft trademarks or logos is subject to and must follow Microsoft's Trademark & Brand Guidelines.
Use of Microsoft trademarks or logos in modified versions of this project must not cause confusion or imply Microsoft sponsorship.
Any use of third-party trademarks or logos are subject to those third-party's policies.


