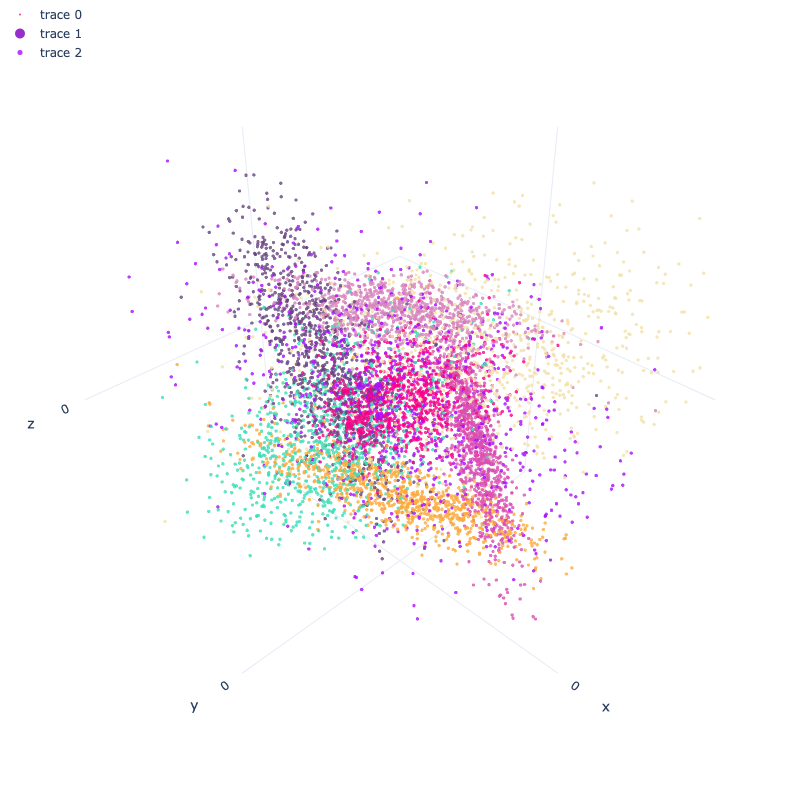
A simulation of the kNN algorithm plotted using the Plotly library. Data is generated using Scikit-learn library, the data has 3 features.
Using GridSearch with different parameters of kNN algorithm built in Scikit-learn library to find the best parameters for the algorithm.
Then use Plotly to draw 3D simulations of the points in the data, with the number of neighbors found from GridSearch, draw those neighbors along with any chosen point to predict.
Origin data:  Predicted point and k nearest points:
The predicted point is mark the same color as the predicted class, and the k nearest points are mark the same color as the predicted class.