
- Introduction
- Methods
- Technologies
- Dependencies
- Data Collection
- Data Cleaning
- Data Visualization and Conclusion
- Further Notes
What college factors will provide students with success after graduation? Provided publicly by the U.S. Department of Education's College Scorecard, this data visualization project aims to identify factors that may lead to student success post-undergraduate completion. For the scope of this project, the collected data is limited to 4-year, bachelor-granting active colleges, and student success is defined as the average salary students make a few years after their college graduation (6 & 10 years after).
- Web API (via the College Scorecard API link here)
- Data Cleaning
- Data Manipulation
- Data Analysis
- Data Visualization
- ETL
- Python
The following python libraries are used in this project:
# For general python dataFrame manipulation, aggregations, and plots.
import pandas as pd
import numpy as np
import matplotlib.pyplot as plt

# For handling API calls.
import requests
from pprint import pprint
from config import api_key

# For user-friendly data file access.
import os
import shutilClick here for code reference.
The actual open-source data can be found on the Department of Education's API documentation page here where users and developers alike can register for their own API key here. The API documentation page provides a step-by-step guide on how to manipulate their Web API link format as well as a data dictionary reference in the form of an excel spreadsheet.
Under the "Categories of Data" title in the API documentation page, this section lists all of the fields within the dataset. To look at what makes a student successful, the metrics chosen for this project are:
- The school - the school's name and ownership (public/ private non-profit/ private for-profit), and its faculties
- The students - student's school retention and completion rates
- Entry difficulty - how hard it is to get admitted into a school, especially via SAT scores
- Students earnings - mean salary earnings 6 and 10 years after entering school (this means 2-6 years minimum after graduating)
To start off, the base url for the college scorecard lives at http://api.data.gov/ed/collegescorecard/ (which is inaccessible without an API key). The remaining query url are from the parameters and metrics defined as above. Once again, for the scope of this project, the school parameters were defined as "currently operating", "bachelor-granting", and at least "4-year". In order to call the API for the remaining field metrics, a dictionary was created to hold the key column names and metric values. Below is a snippet of the data collection coding:
# Accessing the college scorecard API.
# The endpoint for querying all data is /v1/schools
base_url = "https://api.data.gov/ed/collegescorecard/v1/schools?"
base_url = f"{base_url}api_key={api_key}&fields="

# Dictionary all the desired fields.
year = "latest"
fields = {
          "School Name": "school.name",
          "School ID": "id",
          "School State": "school.state",
          "School Ownership": "school.ownership",
         }

# The final query url should look like this.
query_url = f"{base_url}{fields_url}{parameters_url}&page={page_num}&_per_page={per_page}"
It is important to note that the requested API call will return a JSON format url that returns 100 records maximum per page. Therefore, the page number and per page settings were set to collect every single record that met the criteria defined within the field metrics and parameters.
Click here for code reference.
After collecting all the necessary data into a master python dataFrame, further data cleaning was performed to update and format the dataFrame to be easily accessible and user-friendly.
After cleaning up the master dataFrame, the master dataFrame was then split into four separate sub-dataFrames based on each individual field metrics to be compared against student earnings as that was the goal. These sub-dataFrames were further cleaned up to remove rows with null values and to perform some data aggregations.
The four sub-dataFrame metrics were defined as:
- School ownership and admission rate
- School selectiveness
- Student retention and completion rate
- Faculty rate and faculty salary
Each of the four sub-dataFrame includes:
- Student mean earnings (6 years after entry)
- Student mean earnings (10 years after entry)
# Data cleaning example:
# Collecting the master dataFrame.
school_df = pd.read_csv(os.path.join("Resources", "CSV", "General", "Schools_DF.csv"))

# Creating sub-dataFrame to Analyze School Ownership and Admission Rates.
school_ownership_df = school_df[["School ID", "School Name", "School State", "School Ownership",
                           "Admission Rate (%)", "Mean Earnings (10 Yrs after Entry)", "Mean Earnings (6 Yrs after Entry)"
                                 ]].copy()

# Further cleaning sub-dataFrame.
clean_school_ownership_df = school_ownership_df.dropna()

# Making data aggregations.
admission_mean = clean_school_ownership_df["Admission Rate (%)"].mean()
admission_max = clean_school_ownership_df["Admission Rate (%)"].max()
admission_min = clean_school_ownership_df["Admission Rate (%)"].min()Click here for code reference.

Count of all existing, 4-year, bachelor-granting (undergraduate) schools by school ownership.

Private for-profit schools have a right-skewed distribution (higher concentration of schools from 50-75% of interquartile range (IQR or range of the box)). There are more students earning more than students earning less, but there is a noticeable equilibration of student earnings at 10 years after entry. From 6 years to 10 years after entry, the box-and-whiskers then to go towards similar ranges and distributions.

By comparing admission rates (%) against mean earnings($), the more difficult it is to get accepted into certain colleges, the more likely the students will make higher earnings. These students in tough schools are also more likely to make the greatest increase in earnings from 6 years to 10 years after entry. From 6 years to 10 years after entry, students from all three school ownerships tend toward similar ranges of mean earnings.
There is a greater increase in earnings from private non-profit and public organizations from 6 to 10 years compared to private for-profit. However, note that there is a very small sample size for private for-profit organizations.
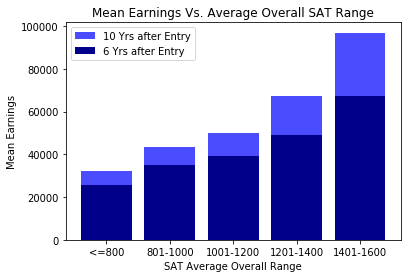
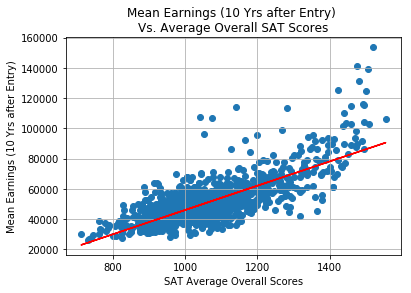
The average SAT score versus annual mean earnings analysis indicates that the graduates of the most selective colleges tend to earn more, the trend is more apparent for the mean earnings (10 years after entry). The scatter plot and the corresponding trendline indicates that average SAT scores has a positive correlation with mean earnings (10 years after entry) although the relationship seems weak for colleges with “average SAT scores” that are less than 1200.
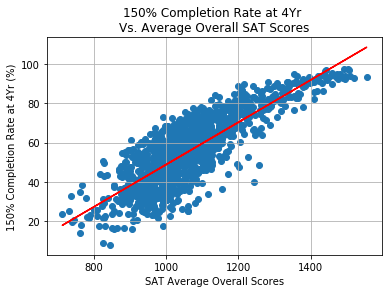
The scatter plot and the corresponding trendline indicates that average SAT scores has a positive correlation with completion rate, indicating that the most selective colleges tend to have a higher student completion rate compared to the rest of colleges. It is noteworthy that less than 15% of colleges have average SAT score above 1200 and only ~3% of them above 1400 being the most selective schools, and majority of colleges ~85% have average SAT scores that range between 800-1200.

The scatter plot and the corresponding trendline indicates that attendance cost per academic year does not have a strong relationship with average SAT scoress, as the public institutions tend to cost much less than the private institutions regardless of their selectiveness. However, the plot also indicates that majority of the most selective colleges (average SAT score > 1400) tend to cost significantly more.


The retention rate is the rate of students returning to the school each year of a 4-year bachelor degree program while the completion rate is counting 4-year programs completed within 6 years. 90-100% range showed significant increase of mean earnings (students who are more successful). This goes to show that schools that are good enough to retain and commit their students well enough towards graduation, the better success the students will see after completion. There is also a noticeable student earning decline from 10% to 60% at the 10-year mean earnings metric, but that could be due to other unforseen outliers.


Both scatter plots compare school full-time faculty rate and faculty salary against student salary earnings 10 year after college entry. There is no correlation between full-time faculty rate and student earnings, however, there is a noticeably good correlation between faculty salary and student salary. This data shows that no matter how much of a school's faculty is full-time, it does not relate to how much a student will earn. Yet, the more money the faculty makes, the more likely the students will be very successful in earning more after graduation. Although not shown here, the visualization is very similar for student salary earnings 6 years after college entry.
More descriptive and visual information can be found in the presentation slides provided here.