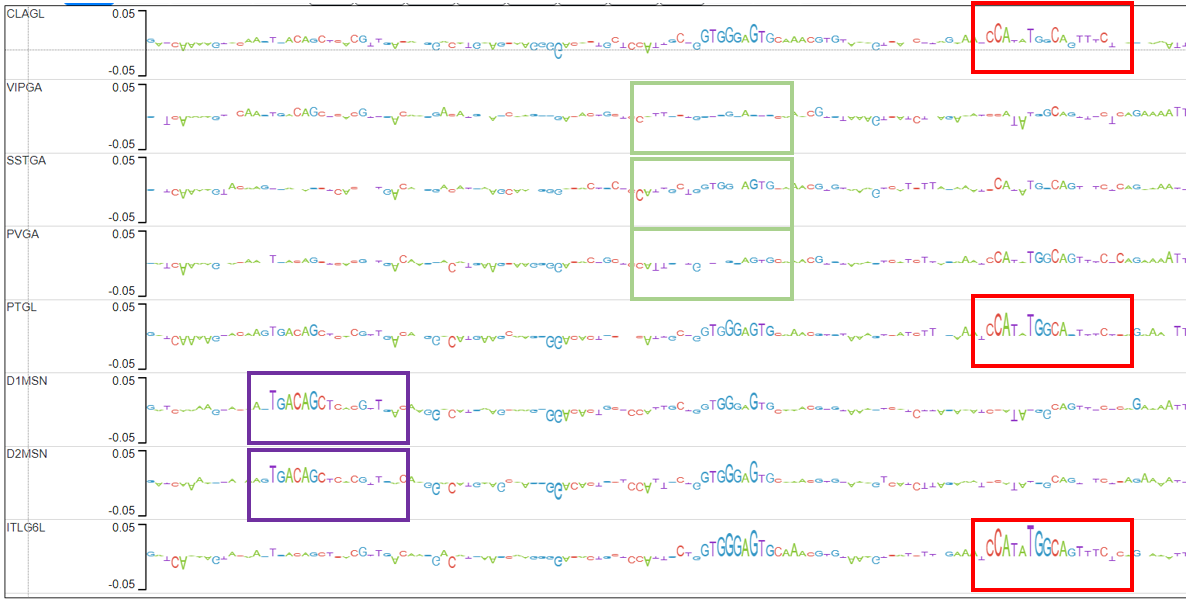
The goal is to find subsequences of mouse DNA which impact chromatin accessibility significantly in one cell type, but have little or none impact in other cell types. In other words, we are looking for cell-type specific motifs that potentially play a role in gene expression and regulation.
-
- Train SVMs (nonlinear gapped k-mer SVMS to be precise) on chromatin accesibility data on 10 different mouse cell types.
-
- Evaluate performance of the trained models. If the models are not good enough go back to step 1.
-
- For each SVM, compute explain scores (contribution to model's output at basepair resolution).
-
- Find subsequences where the explain scores of one model are relatively large and differ significantly from the explain scores of the models trained on the other cell types.
-
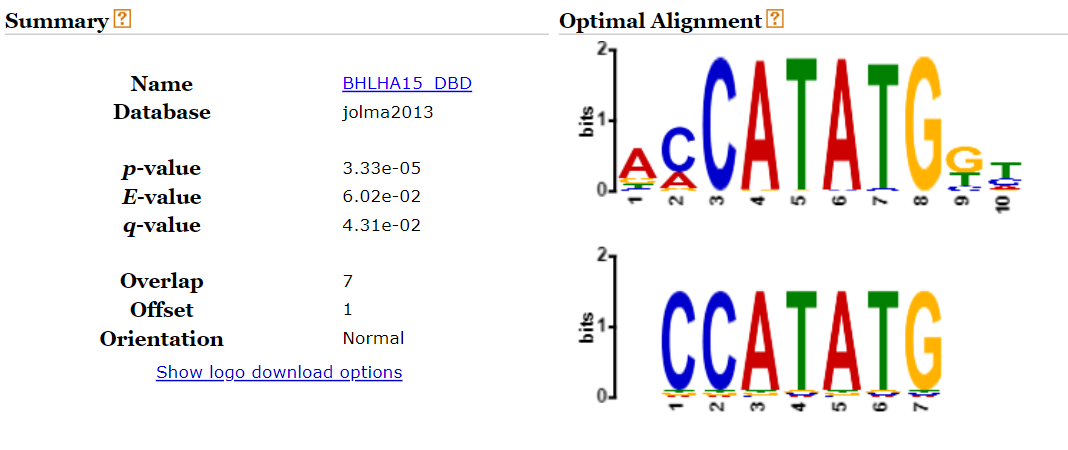
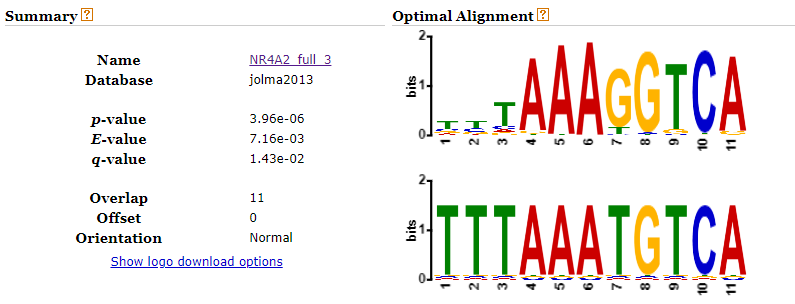
- Check if the subsequences found match a known motif (using TomTom) and create a list of candidate subsequences.
We are assuming that explain scores (defined as the predictive contribution of every nucleotide in an input DNA sequence to its associated output label through the lens of a gkm-SVM model) accurately reflect the effect on chromatin accesibility each base-pair has.
More information on how explain scores are computed can be found in the original paper.
The C package lsgkm was used to train the SVMs. Go to the KundajeLab lsgkm repo in order to install it (you will need it if you want to train the models or compute more explain scores).
Basically this splits the peak in overlapping subsequences of length w, computes the L2 distance between each pair of subsequences, and takes the max of those distances.
Why this distance function? We want to check if, in a given peak (>200 basepairs) there exists a subsequence (~10 basepairs) which differs significantly. Thus, global similarity measures are not suitable. The main drawback of this distance is that the parameter w needs to be tuned. If w is too small, spurious motifs may be captured, and if w is too large, most short motifs are missed.
The values chosen for were 8, 13 and 20.
The cell types of interest are: CLAGL, D1MSN, D2MSN, ITL6GL, NPGL, PTGL, PVGA, SSTGA, VIPGA. You can find more about the properties of these cell types in the CATLAS.
- The scripts for Steps 1, 2 and 3. (Which is a modified version of SVM pipeline repo.)
- The python modules for Steps 4 and 5.
- Jupyter notebooks for illustration and analysis of the results.
The genome browser session can be accessed at: Juan's genome browser session.
A detailed, step-by-step example of how these motifs are detected and analyzed can be found in this jupyter notebook.
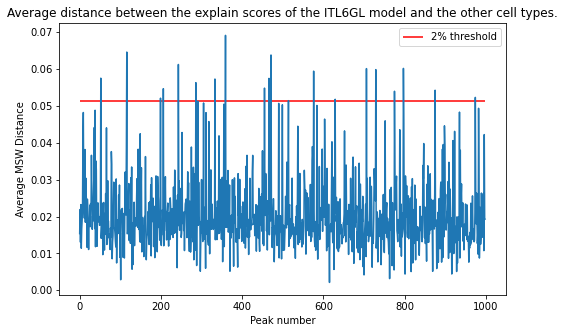
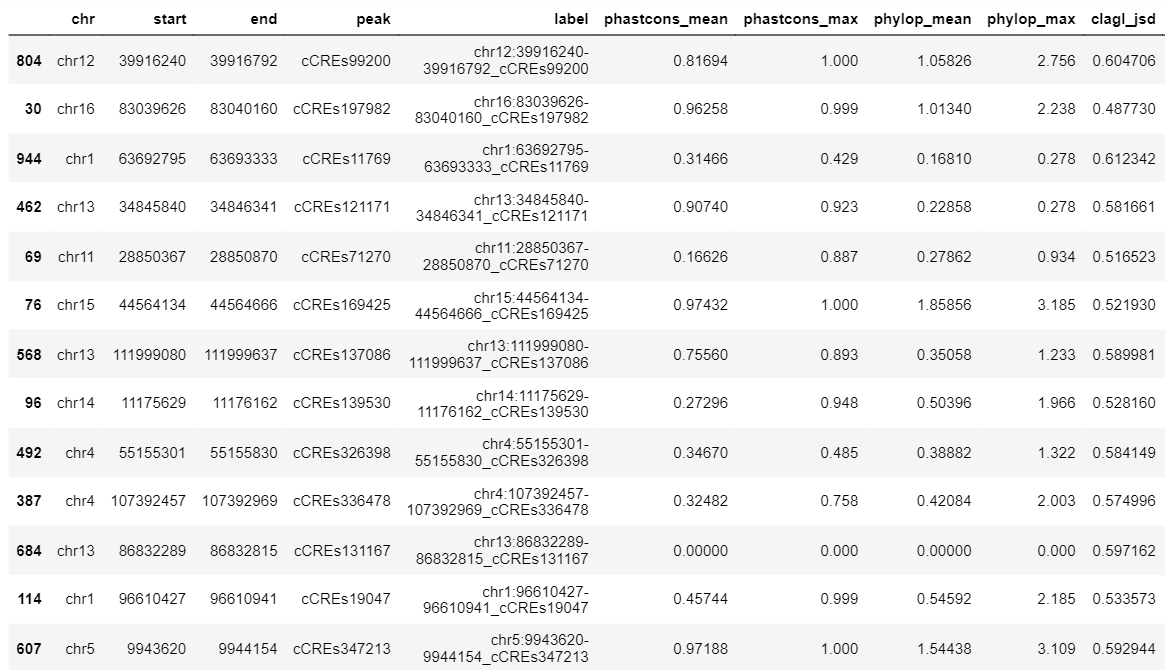
The candidate peaks are those in which the average distance between the explain scores of the ITL6GL model and the explain scores of the rest of the models is in the top 2% (above red line).
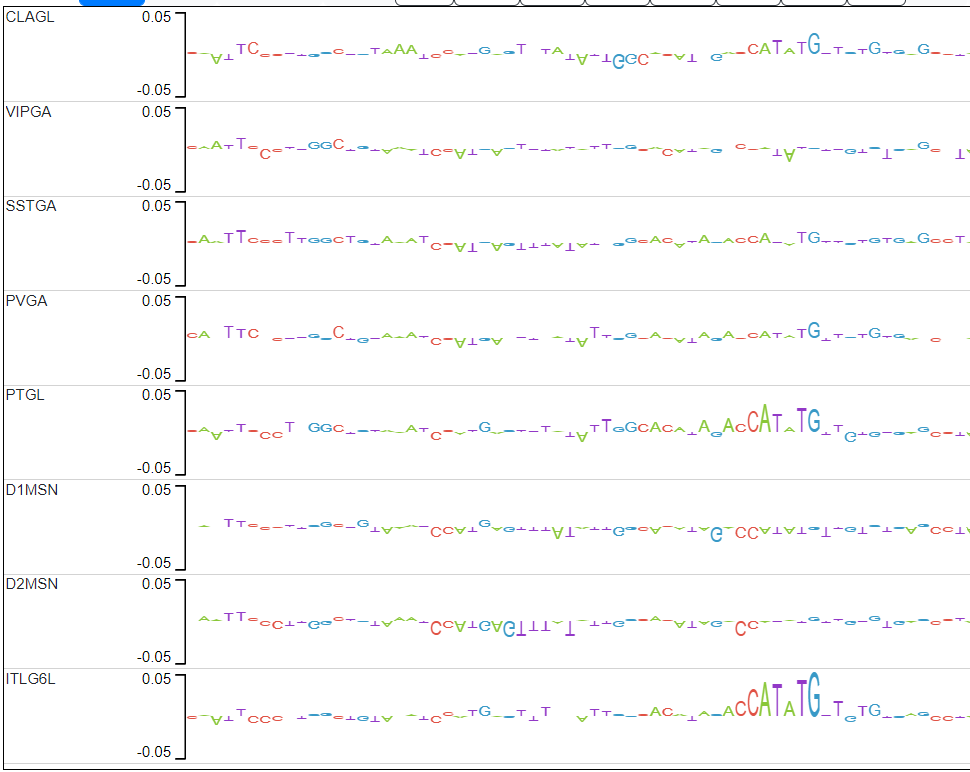
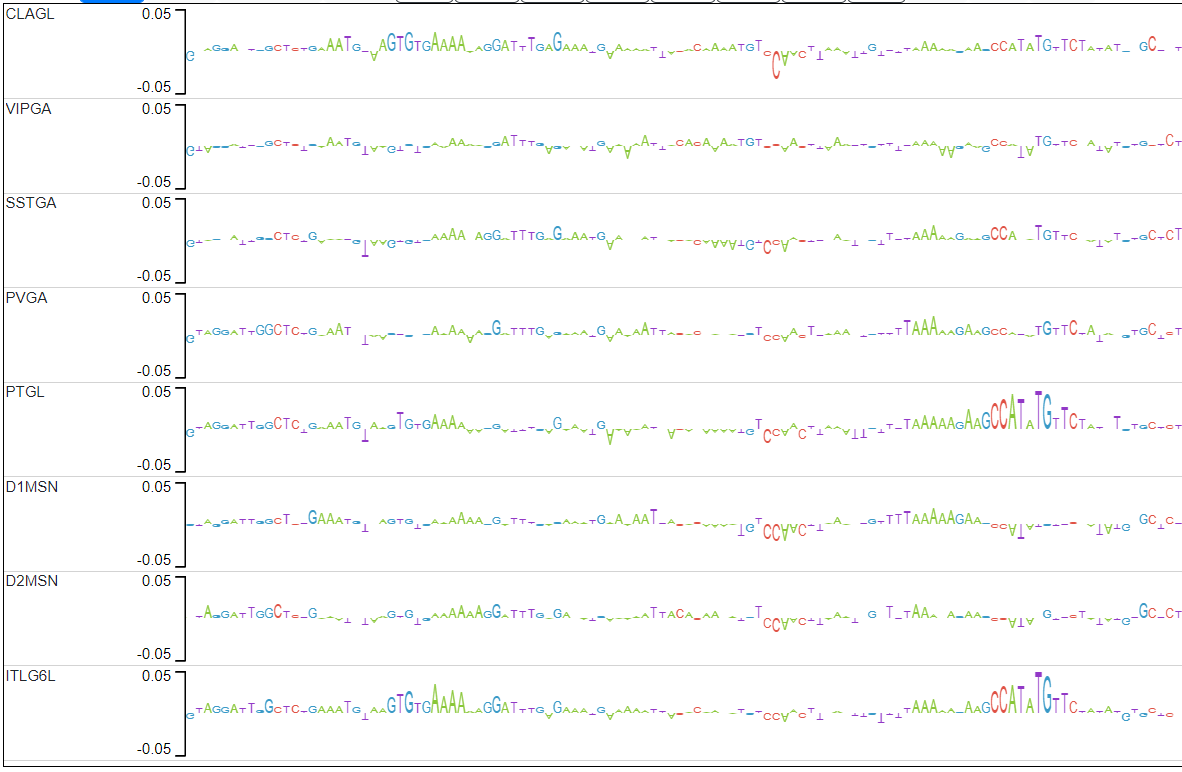
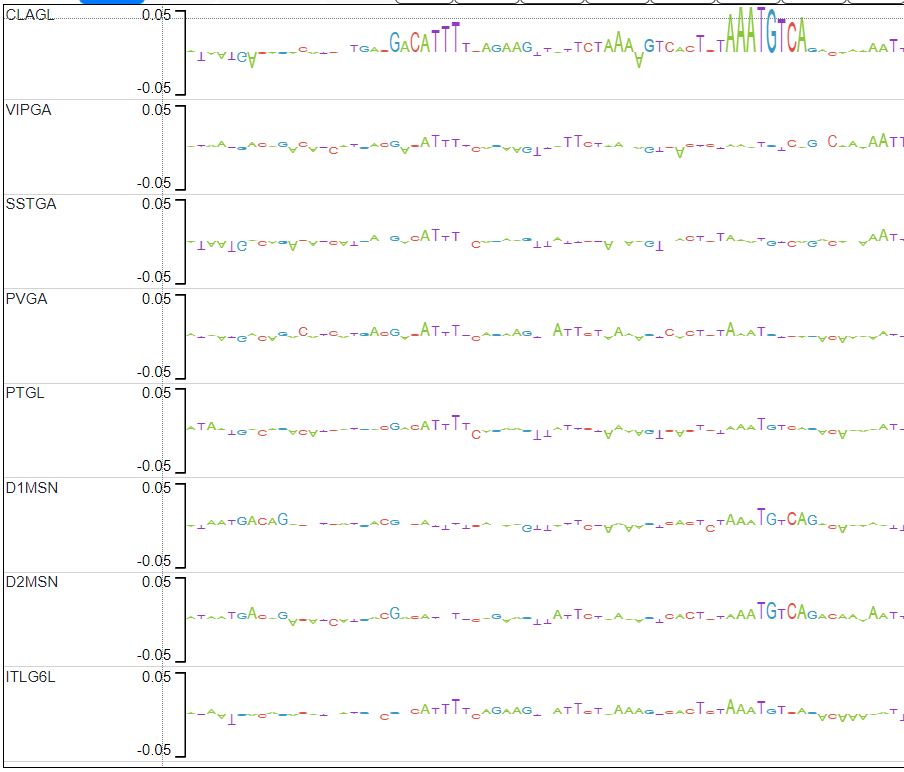
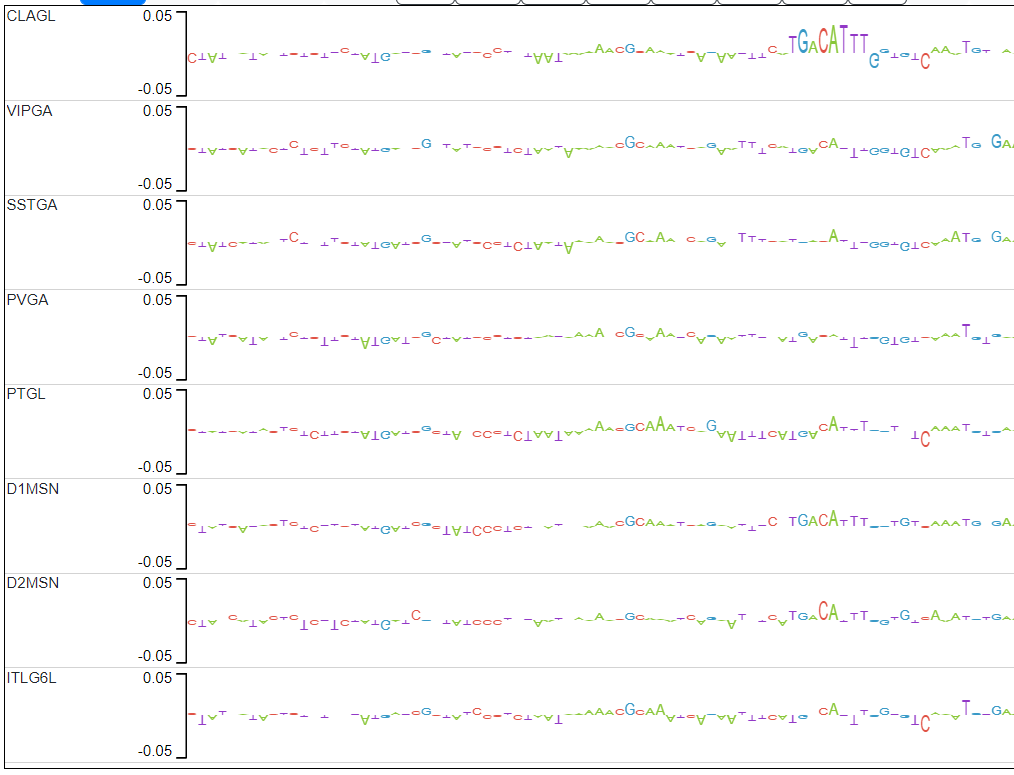
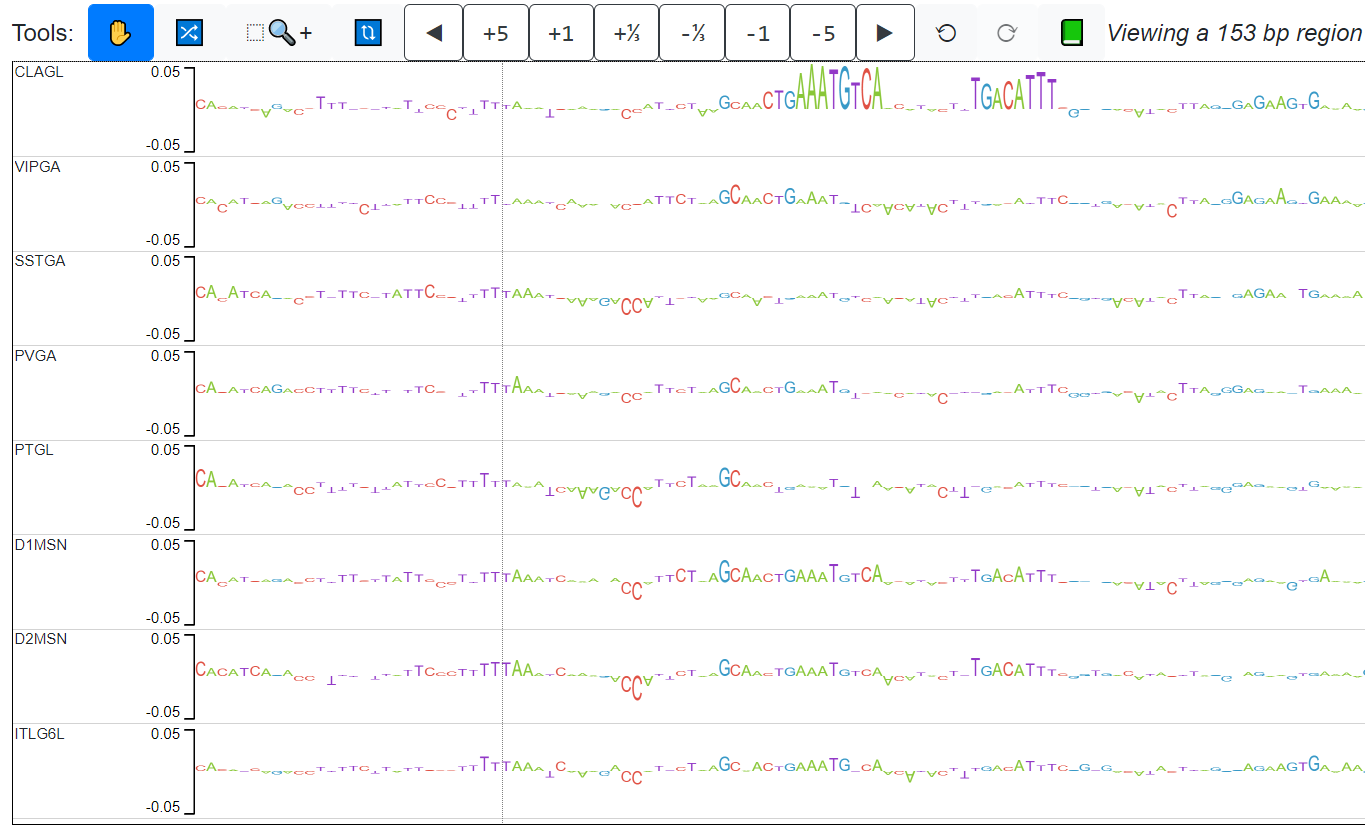
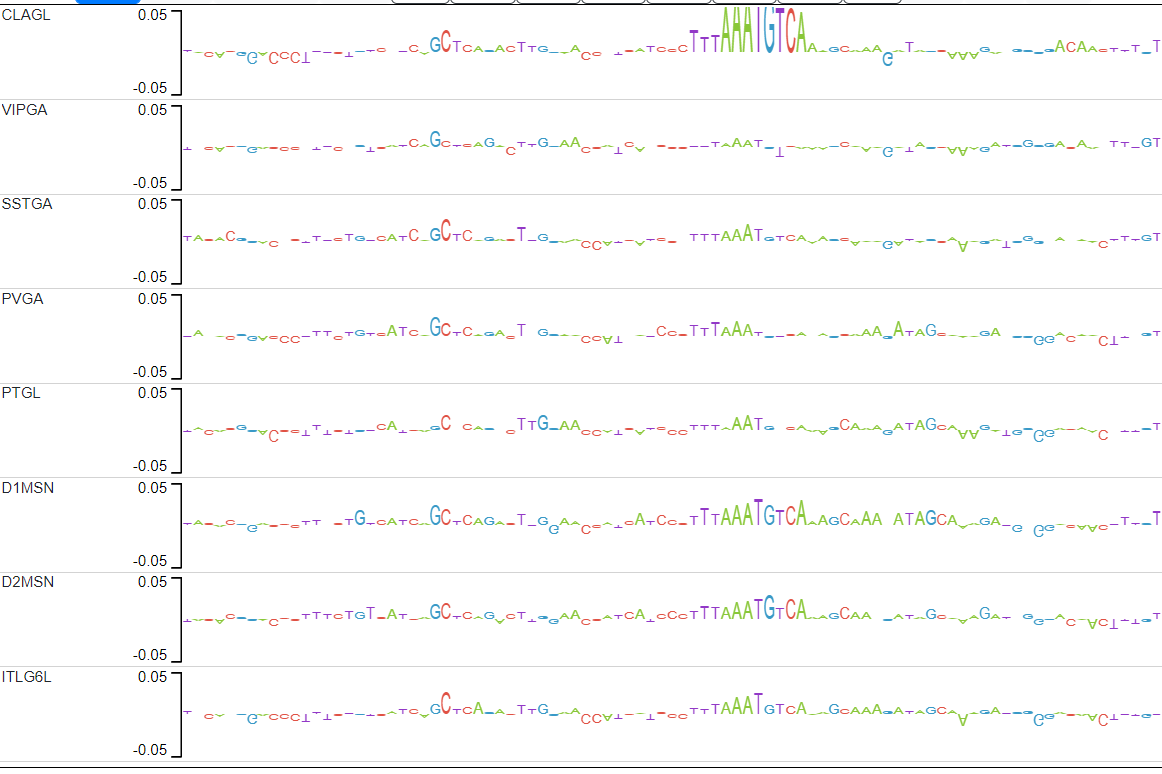
Candidate 1 actually has 2 examples of motifs that pop up only in CLAGL.
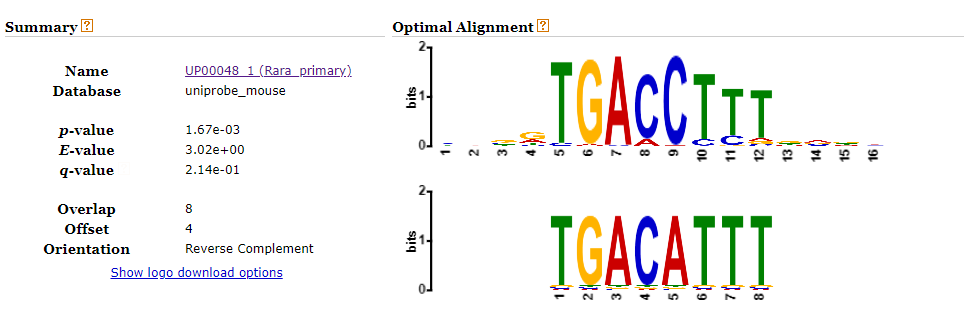
Looking up the second candidate motif (TGACATTT) in TOM TOM yields the following match in mouse DNA:
