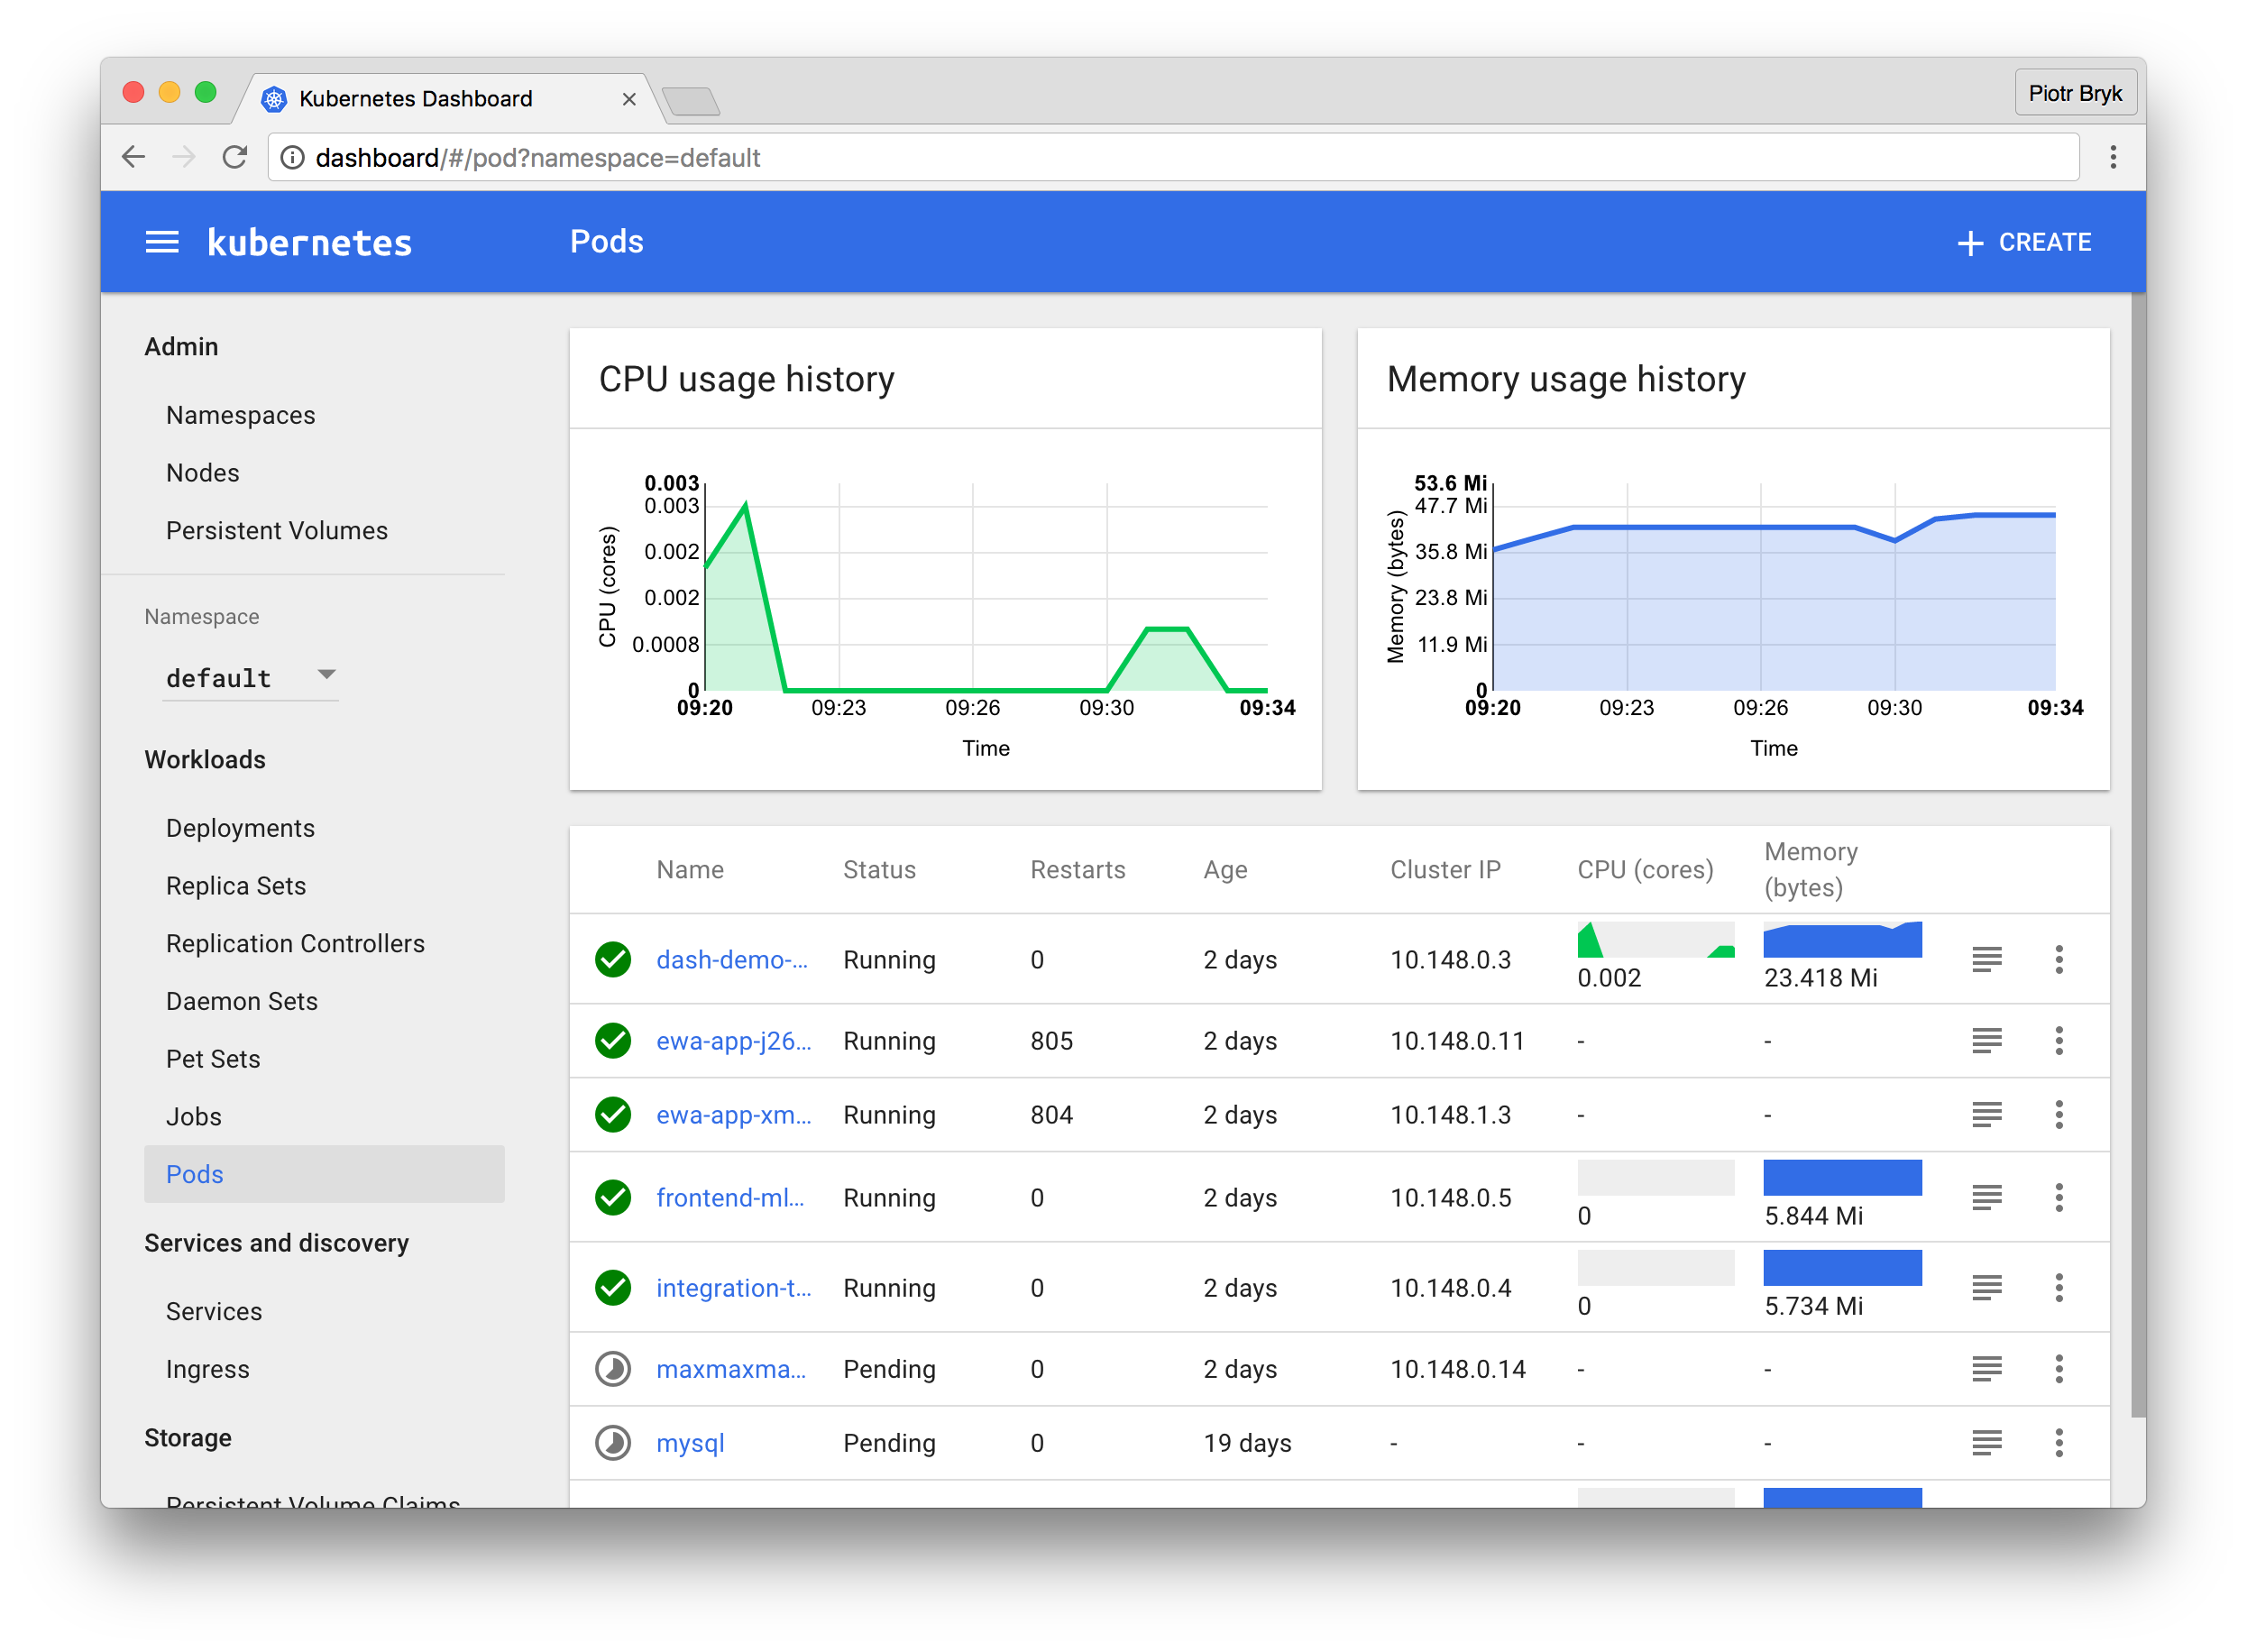
Kubernetes Dashboard is a general purpose, web-based UI for Kubernetes clusters. It allows users to manage applications running in the cluster and troubleshoot them, as well as manage the cluster itself.
It is likely that the Dashboard is already installed on your cluster. To access it navigate in your
browser to the following URL: https://<kubernetes-master>/ui.
If you find that you’re not able to access the Dashboard, you can install and open the latest stable release by running the following commands:
kubectl create -f https://rawgit.com/kubernetes/dashboard/master/src/deploy/kubernetes-dashboard.yamlAnd then navigate to https://<kubernetes-master>/ui
If it asks for a password, use $ kubectl config view to find it.
Note that for the metrics and graphs to be available you need to have Heapster running in your cluster.
Alternatively, you may access the UI via the Service Proxy. This is useful if you have a kubectl
configured with access to the cluster, but lack password credentials for use in a browser:
kubectl proxyThis will make the dashboard available at http://localhost:8001/ui
This will only be available from the machine where the command is executed, but you can see
kubectl proxy --help for more options.
-
The user guide is an entry point for users of Dashboard
-
The design overview describes design concepts of Dashboard
-
The developer guide is for anyone wanting to contribute to Dashboard
-
The troubleshooting guide is a collection of typical setup problems
The work done has been licensed under Apache License 2.0. The license file can be found here. You can find out more about the license at:
