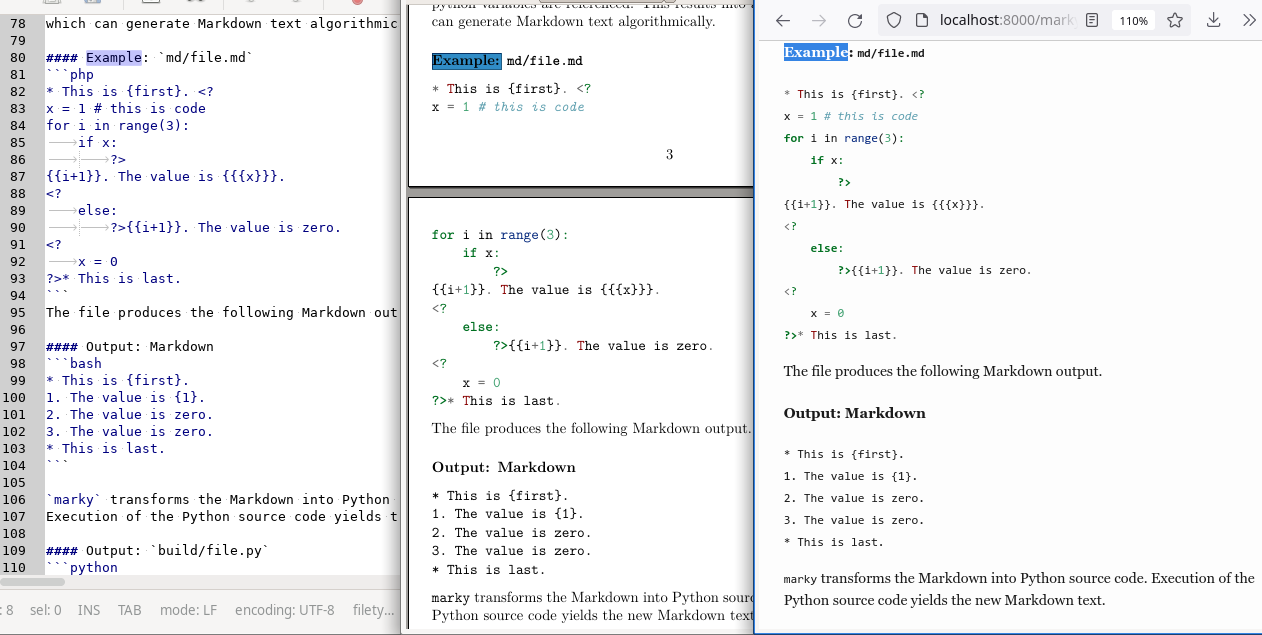
markyDynamic Markdown--markyMarkdown Text (Left) is rendered into PDF (Middle) and HTML (Right) by just callingmake scan; make all.
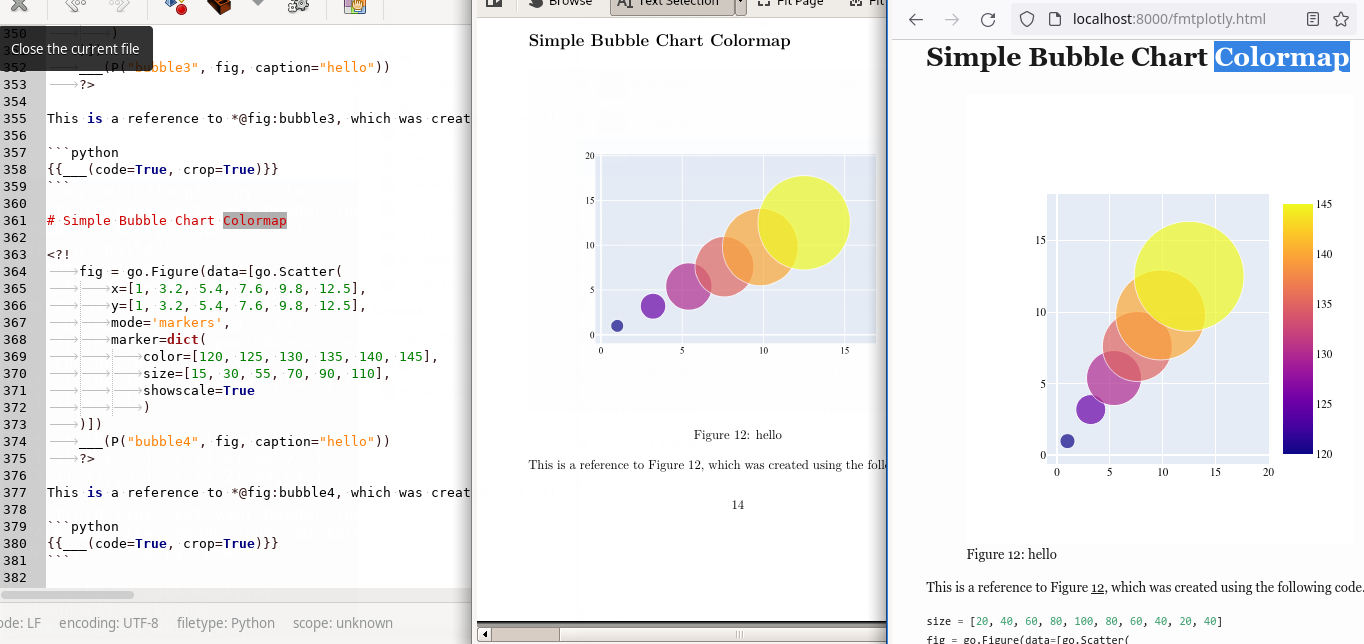
fmtplotlyPlot Generation forhtmlusingplotly--markyMarkdown Text (Left) is rendered in PDF (Middle) and HTML (Right)
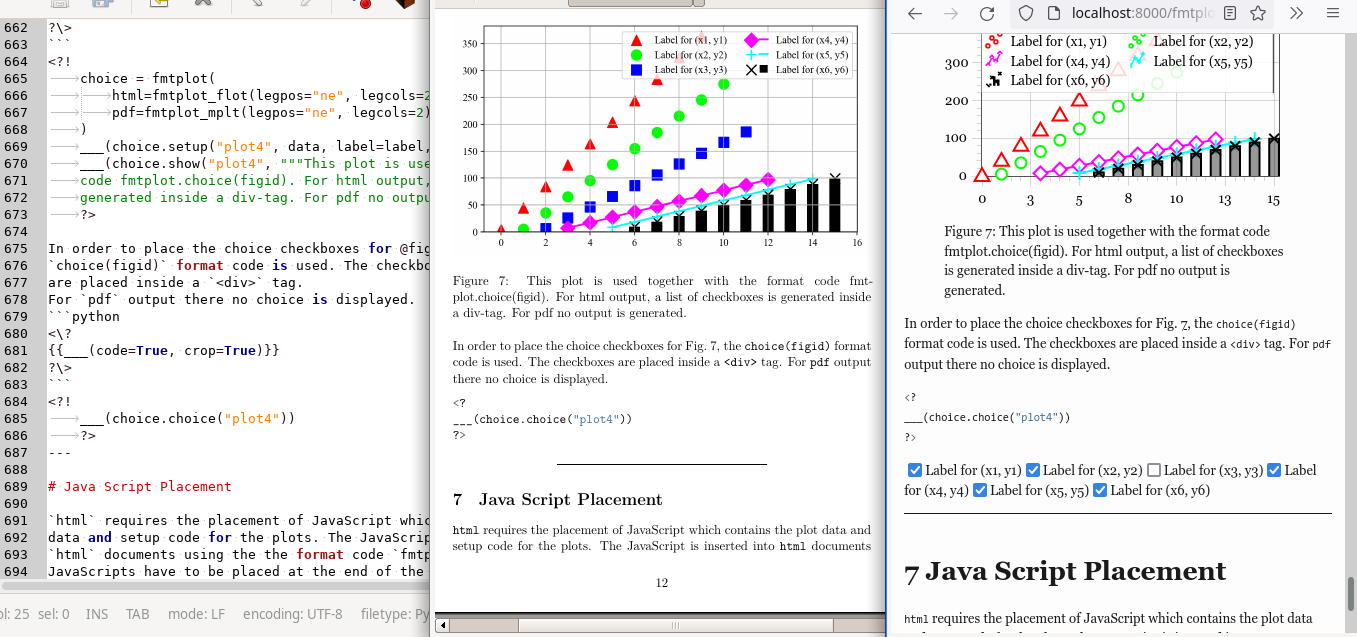
fmtplotPlot Generation forhtmlusingflotandmatplotlib--markyMarkdown Text (Left) is rendered in PDF (Middle) and HTML (Right)
Abstract-- ...
plotly is a charting and plotting library.
pip install plotlyimport plotly as py
import plotly.subplots as sp
import plotly.graph_objs as go
import plotly.figure_factory as ff
import plotly.express as px- https://plotly.com/python/
- https://plotly.com/python/figure-structure/
- https://plotly.com/python/basic-charts/
- https://plotly.com/python/creating-and-updating-figures/
- https://plotly.github.io/plotly.py-docs/
- https://plotly.com/python/configuration-options/
P = fmtplotly()fig = sp.make_subplots(rows=1, cols=1, print_grid=True)
fig.add_scatter(x=[1, 2, 3, 4, 5], y=[5, 1, 4, 2, 3],
mode='markers', marker=dict(size=3), row=1, col=1)___(P("figid", fig, caption="Put the figure caption text here ..."))This is a reference to *@fig:plotgrid, which was created using the following code.
import numpy as np
import pandas as pd

tickers = ["A", "B"]
n = len(tickers)

prices = []
for ticker in tickers:
	prices.append(np.random.rand(100))
df = pd.DataFrame( prices ).transpose()
df.columns = tickers
df.head()

fig = sp.make_subplots(rows=n, cols=n, print_grid=True,
	horizontal_spacing= 0.05, vertical_spacing= 0.05)
coords = [(i,j) for i in range(1, n+1) for j in range(1, n+1)]

for m, (i, j) in enumerate(coords, start=1):
	row_ticker = df.columns[i - 1]
	col_ticker = df.columns[j - 1]
	if i == j:
		x = df[row_ticker]
		x_grid = np.linspace(x.min(), x.max(), 100)
		elem = fig.add_histogram(x=x, histnorm='probability density', row=i, col=j)
	else:
		elem = fig.add_scatter(x=df[row_ticker], y=df[col_ticker], mode='markers', marker=dict(size=3), row=i, col=j)
	if i == n:
		fig['layout']['xaxis'+str(m)].update(title=col_ticker)
	if j == 1:
		fig['layout']['yaxis'+str(m)].update(title=row_ticker)

fig.update_layout(title='Random Data Plot')
___(P("plotgrid", fig, caption="hello", height=P.width))This is a reference to *@fig:quiver, which was created using the following code.
x1,y1 = np.meshgrid(np.arange(0, 2, .2), np.arange(0, 2, .2))
u1 = np.cos(x1)*y1
v1 = np.sin(x1)*y1
fig = ff.create_quiver(x1, y1, u1, v1)
fig.update_layout(title='Random Data Plot')
___(P("quiver", fig, caption="hello"))This is a reference to *@fig:barandline, which was created using the following code.
fig = sp.make_subplots(rows=1, cols=2)
fig.add_trace(go.Scatter(y=[4, 2, 1], mode="lines"), row=1, col=1)
fig.add_trace(go.Bar(y=[2, 1, 3]), row=1, col=2)
fig.update_layout(title='Random Data Plot')
___(P("barandline", fig, caption="hello"))This is a reference to *@fig:iris, which was created using the following code.
df = px.data.iris()
fig = px.scatter(df, x="sepal_width", y="sepal_length", color="species",
				 title="Using The add_trace() method With A Plotly Express Figure")
fig.add_trace(
	go.Scatter(
		x=[2, 4],
		y=[4, 8],
		mode="lines",
		line=go.scatter.Line(color="gray"),
		showlegend=False)
)
___(P("iris", fig, caption="hello"))This is a reference to *@fig:barpoint, which was created using the following code.
df = px.data.iris()
fig = px.scatter(df, x="sepal_width", y="sepal_length", color="species", facet_col="species",
				 title="Adding Traces To Subplots Witin A Plotly Express Figure")
reference_line = go.Scatter(x=[2, 4],
							y=[4, 8],
							mode="lines",
							line=go.scatter.Line(color="gray"),
							showlegend=False)
fig.add_trace(reference_line, row=1, col=1)
fig.add_trace(reference_line, row=1, col=2)
fig.add_trace(reference_line, row=1, col=3)
___(P("refline", fig, caption="hello"))This is a reference to *@fig:scattertrace, which was created using the following code.
fig = sp.make_subplots(rows=1, cols=2)
fig.add_scatter(y=[4, 2, 3.5], mode="markers",
				marker=dict(size=20, color="LightSeaGreen"),
				name="a", row=1, col=1)
fig.add_bar(y=[2, 1, 3],
			marker=dict(color="MediumPurple"),
			name="b", row=1, col=1)
fig.add_scatter(y=[2, 3.5, 4], mode="markers",
				marker=dict(size=20, color="MediumPurple"),
				name="c", row=1, col=2)
fig.add_bar(y=[1, 3, 2],
			marker=dict(color="LightSeaGreen"),
			name="d", row=1, col=2)
___(P("barpoint", fig, caption="hello"))This is a reference to *@fig:bubble1, which was created using the following code.
df = px.data.iris()
fig = px.scatter(df, x="sepal_width", y="sepal_length", color="species",
				 title="Conditionally Updating Traces In A Plotly Express Figure With for_each_trace()")
fig.for_each_trace(
	lambda trace: trace.update(marker_symbol="square") if trace.name == "setosa" else (),
)
___(P("scattertrace", fig, caption="hello"))This is a reference to *@fig:bubble2, which was created using the following code.
fig = go.Figure(data=[go.Scatter(
	x=[1, 2, 3, 4], y=[10, 11, 12, 13],
	mode='markers',
	marker_size=[40, 60, 80, 100])
])
___(P("bubble1", fig, caption="hello"))This is a reference to *@fig:bubble3, which was created using the following code.
fig = go.Figure(data=[go.Scatter(
	x=[1, 2, 3, 4], y=[10, 11, 12, 13],
	mode='markers',
	marker=dict(
		color=['rgb(93, 164, 214)', 'rgb(255, 144, 14)',
			   'rgb(44, 160, 101)', 'rgb(255, 65, 54)'],
		opacity=[1, 0.8, 0.6, 0.4],
		size=[40, 60, 80, 100],
	)
)])
___(P("bubble2", fig, caption="hello"))This is a reference to *@fig:bubble4, which was created using the following code.
size = [20, 40, 60, 80, 100, 80, 60, 40, 20, 40]
fig = go.Figure(data=[go.Scatter(
	x=[1, 2, 3, 4, 5, 6, 7, 8, 9, 10],
	y=[11, 12, 10, 11, 12, 11, 12, 13, 12, 11],
	mode='markers',
	marker=dict(
		size=size,
		sizemode='area',
		sizeref=2.*max(size)/(40.**2),
		sizemin=4
	)
)])
___(P("bubble3", fig, caption="hello"))This is a reference to *@fig:sankey, which was created using the following code.
fig = go.Figure(data=[go.Scatter(
	x=[1, 3.2, 5.4, 7.6, 9.8, 12.5],
	y=[1, 3.2, 5.4, 7.6, 9.8, 12.5],
	mode='markers',
	marker=dict(
		color=[120, 125, 130, 135, 140, 145],
		size=[15, 30, 55, 70, 90, 110],
		showscale=True
		)
)])
___(P("bubble4", fig, caption="hello"))This is a reference to *@fig:piechart, which was created using the following code.
labels = ['Oxygen','Hydrogen','Carbon_Dioxide','Nitrogen']
values = [4500, 2500, 1053, 500]
fig = go.Figure(data=[go.Pie(labels=labels, values=values)])
___(P("piechart", fig, caption="hello"))This is a reference to *@fig:piecrot, which was created using the following code.
labels = ['Oxygen','Hydrogen','Carbon_Dioxide','Nitrogen']
values = [4500, 2500, 1053, 500]
fig = go.Figure(data=[go.Pie(labels=labels, values=values, textinfo='label+percent',
							 insidetextorientation='radial'
							)])
___(P("piecrot", fig, caption="hello"))This is a reference to *@fig:piehole, which was created using the following code.
labels = ['Oxygen','Hydrogen','Carbon_Dioxide','Nitrogen']
values = [4500, 2500, 1053, 500]
fig = go.Figure(data=[go.Pie(labels=labels, values=values, hole=.3)])
___(P("piehole", fig, caption="hello"))This is a reference to *@fig:barxrot, which was created using the following code.
months = ['Jan', 'Feb', 'Mar', 'Apr', 'May', 'Jun',
		  'Jul', 'Aug', 'Sep', 'Oct', 'Nov', 'Dec']
fig = go.Figure()
fig.add_trace(go.Bar(
	x=months,
	y=[20, 14, 25, 16, 18, 22, 19, 15, 12, 16, 14, 17],
	name='Primary Product',
	marker_color='indianred'
))
fig.add_trace(go.Bar(
	x=months,
	y=[19, 14, 22, 14, 16, 19, 15, 14, 10, 12, 12, 16],
	name='Secondary Product',
	marker_color='lightsalmon'
))
# Here we modify the tickangle of the xaxis, resulting in rotated labels.
fig.update_layout(barmode='group', xaxis_tickangle=-45)
___(P("barxrot", fig, caption="hello"))This is a reference to *@fig:linetext, which was created using the following code.
df = px.data.gapminder().query("country in ['Canada', 'Botswana']")
fig = px.line(df, x="lifeExp", y="gdpPercap", color="country", text="year")
fig.update_traces(textposition="bottom right")
___(P("linetext", fig, caption="hello"))This is a reference to *@fig:linemini, which was created using the following code.
df = px.data.stocks(indexed=True)
fig = px.line(df, facet_row="company", facet_row_spacing=0.01, height=200, width=200)
fig.update_xaxes(visible=False, fixedrange=True)
fig.update_yaxes(visible=False, fixedrange=True)
fig.update_layout(annotations=[], overwrite=True)
fig.update_layout(
	showlegend=False,
	plot_bgcolor="white",
	margin=dict(t=10,l=10,b=10,r=10)
)
___(P("linemini", fig, caption="hello"))This is a reference to *@fig:linenp, which was created using the following code.
x = np.arange(10)
fig = go.Figure(data=go.Scatter(x=x, y=x**2))
___(P("linenp", fig, caption="hello"))This is a reference to *@fig:linesnp, which was created using the following code.
N = 100
random_x = np.linspace(0, 1, N)
random_y0 = np.random.randn(N) + 5
random_y1 = np.random.randn(N)
random_y2 = np.random.randn(N) - 5
fig = go.Figure()
fig.add_trace(go.Scatter(x=random_x, y=random_y0,
					mode='lines',
					name='lines'))
fig.add_trace(go.Scatter(x=random_x, y=random_y1,
					mode='lines+markers',
					name='lines+markers'))
fig.add_trace(go.Scatter(x=random_x, y=random_y2,
					mode='markers', name='markers'))
___(P("linesnp", fig, caption="hello"))This is a reference to *@fig:linestyle, which was created using the following code.
month = ['January', 'February', 'March', 'April', 'May', 'June', 'July',
		 'August', 'September', 'October', 'November', 'December']
high_2000 = [32.5, 37.6, 49.9, 53.0, 69.1, 75.4, 76.5, 76.6, 70.7, 60.6, 45.1, 29.3]
low_2000 = [13.8, 22.3, 32.5, 37.2, 49.9, 56.1, 57.7, 58.3, 51.2, 42.8, 31.6, 15.9]
high_2007 = [36.5, 26.6, 43.6, 52.3, 71.5, 81.4, 80.5, 82.2, 76.0, 67.3, 46.1, 35.0]
low_2007 = [23.6, 14.0, 27.0, 36.8, 47.6, 57.7, 58.9, 61.2, 53.3, 48.5, 31.0, 23.6]
high_2014 = [28.8, 28.5, 37.0, 56.8, 69.7, 79.7, 78.5, 77.8, 74.1, 62.6, 45.3, 39.9]
low_2014 = [12.7, 14.3, 18.6, 35.5, 49.9, 58.0, 60.0, 58.6, 51.7, 45.2, 32.2, 29.1]
fig = go.Figure()
fig.add_trace(go.Scatter(x=month, y=high_2014, name='High 2014',
						 line=dict(color='firebrick', width=4)))
fig.add_trace(go.Scatter(x=month, y=low_2014, name = 'Low 2014',
						 line=dict(color='royalblue', width=4)))
fig.add_trace(go.Scatter(x=month, y=high_2007, name='High 2007',
						 line=dict(color='firebrick', width=4,
							  dash='dash') # dash options include 'dash', 'dot', and 'dashdot'
))
fig.add_trace(go.Scatter(x=month, y=low_2007, name='Low 2007',
						 line = dict(color='royalblue', width=4, dash='dash')))
fig.add_trace(go.Scatter(x=month, y=high_2000, name='High 2000',
						 line = dict(color='firebrick', width=4, dash='dot')))
fig.add_trace(go.Scatter(x=month, y=low_2000, name='Low 2000',
						 line=dict(color='royalblue', width=4, dash='dot')))
fig.update_layout(title='Average High and Low Temperatures in New York',
				   xaxis_title='Month',
				   yaxis_title='Temperature (degrees F)')
___(P("linestyle", fig, caption="hello"))This is a reference to *@fig:linesmooth, which was created using the following code.
x = np.array([1, 2, 3, 4, 5])
y = np.array([1, 3, 2, 3, 1])
fig = go.Figure()
fig.add_trace(go.Scatter(x=x, y=y, name="linear",
					line_shape='linear'))
fig.add_trace(go.Scatter(x=x, y=y + 5, name="spline",
					text=["tweak line smoothness<br>with 'smoothing' in line object"],
					hoverinfo='text+name',
					line_shape='spline'))
fig.add_trace(go.Scatter(x=x, y=y + 10, name="vhv",
					line_shape='vhv'))
fig.add_trace(go.Scatter(x=x, y=y + 15, name="hvh",
					line_shape='hvh'))
fig.add_trace(go.Scatter(x=x, y=y + 20, name="vh",
					line_shape='vh'))
fig.add_trace(go.Scatter(x=x, y=y + 25, name="hv",
					line_shape='hv'))
fig.update_traces(hoverinfo='text+name', mode='lines+markers')
fig.update_layout(legend=dict(y=0.5, traceorder='reversed', font_size=16))
___(P("linesmooth", fig, caption="hello"))This is a reference to *@fig:linesadv, which was created using the following code.
title = 'Main Source for News'
labels = ['Television', 'Newspaper', 'Internet', 'Radio']
colors = ['rgb(67,67,67)', 'rgb(115,115,115)', 'rgb(49,130,189)', 'rgb(189,189,189)']
mode_size = [8, 8, 12, 8]
line_size = [2, 2, 4, 2]
x_data = np.vstack((np.arange(2001, 2014),)*4)
y_data = np.array([
	[74, 82, 80, 74, 73, 72, 74, 70, 70, 66, 66, 69],
	[45, 42, 50, 46, 36, 36, 34, 35, 32, 31, 31, 28],
	[13, 14, 20, 24, 20, 24, 24, 40, 35, 41, 43, 50],
	[18, 21, 18, 21, 16, 14, 13, 18, 17, 16, 19, 23],
])
fig = go.Figure()
for i in range(0, 4):
	fig.add_trace(go.Scatter(x=x_data[i], y=y_data[i], mode='lines',
		name=labels[i],
		line=dict(color=colors[i], width=line_size[i]),
		connectgaps=True,
	))
	# endpoints
	fig.add_trace(go.Scatter(
		x=[x_data[i][0], x_data[i][-1]],
		y=[y_data[i][0], y_data[i][-1]],
		mode='markers',
		marker=dict(color=colors[i], size=mode_size[i])
	))
fig.update_layout(
	xaxis=dict(
		showline=True,
		showgrid=False,
		showticklabels=True,
		linecolor='rgb(204, 204, 204)',
		linewidth=2,
		ticks='outside',
		tickfont=dict(
			family='Arial',
			size=12,
			color='rgb(82, 82, 82)',
		),
	),
	yaxis=dict(
		showgrid=False,
		zeroline=False,
		showline=False,
		showticklabels=False,
	),
	autosize=False,
	margin=dict(
		autoexpand=False,
		l=100,
		r=20,
		t=110,
	),
	showlegend=False,
	plot_bgcolor='white'
)
annotations = []
# Adding labels
for y_trace, label, color in zip(y_data, labels, colors):
	# labeling the left_side of the plot
	annotations.append(dict(xref='paper', x=0.05, y=y_trace[0],
								  xanchor='right', yanchor='middle',
								  text=label + ' {}%'.format(y_trace[0]),
								  font=dict(family='Arial',
											size=16),
								  showarrow=False))
	# labeling the right_side of the plot
	annotations.append(dict(xref='paper', x=0.95, y=y_trace[11],
								  xanchor='left', yanchor='middle',
								  text='{}%'.format(y_trace[11]),
								  font=dict(family='Arial',
											size=16),
								  showarrow=False))
# Title
annotations.append(dict(xref='paper', yref='paper', x=0.0, y=1.05,
							  xanchor='left', yanchor='bottom',
							  text='Main Source for News',
							  font=dict(family='Arial',
										size=30,
										color='rgb(37,37,37)'),
							  showarrow=False))
# Source
annotations.append(dict(xref='paper', yref='paper', x=0.5, y=-0.1,
							  xanchor='center', yanchor='top',
							  text='Source: PewResearch Center & ' +
								   'Storytelling with data',
							  font=dict(family='Arial',
										size=12,
										color='rgb(150,150,150)'),
							  showarrow=False))
fig.update_layout(annotations=annotations)
___(P("linesadv", fig, caption="hello"))

