Feel free to give a star to my new repo, great thanks Awesome-FinTech
I'm so glad that this repo still draws you guys' attention until today. but actually I won't spend any time on it and I've got a much better way to draw dynamic plots in ipython notebook, and I've just post a blog about how to make it in notebooks (including source code and demo notebook).
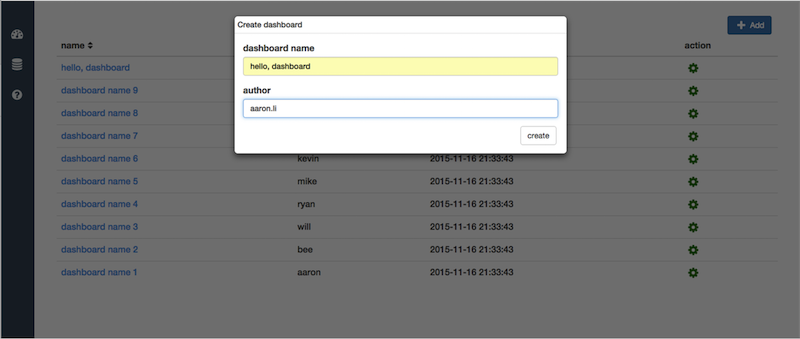
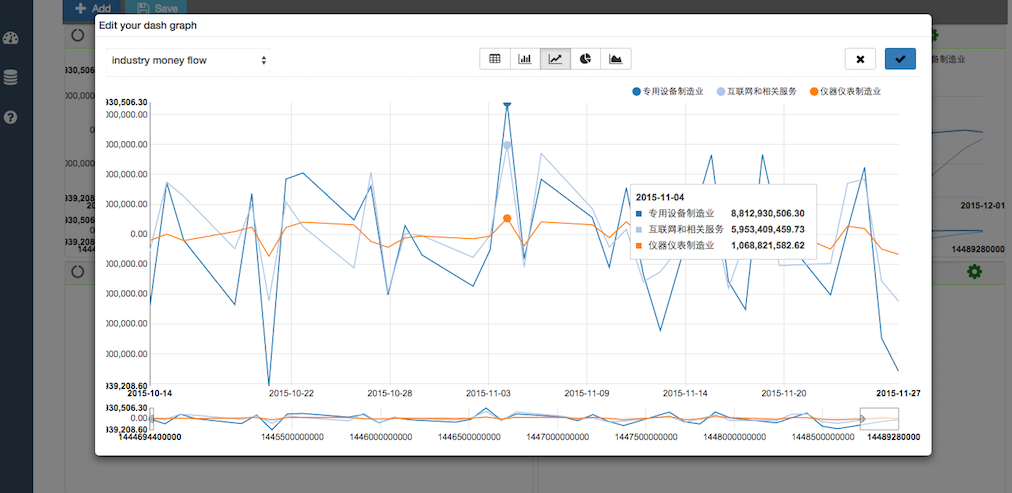
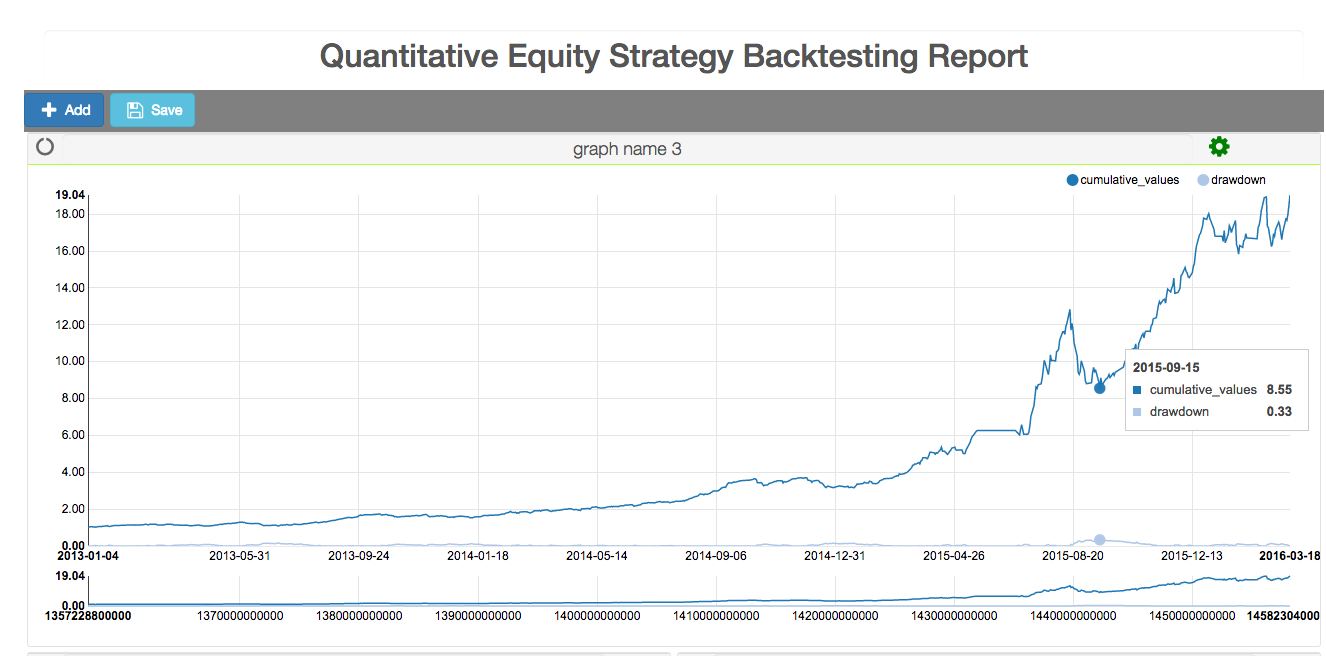
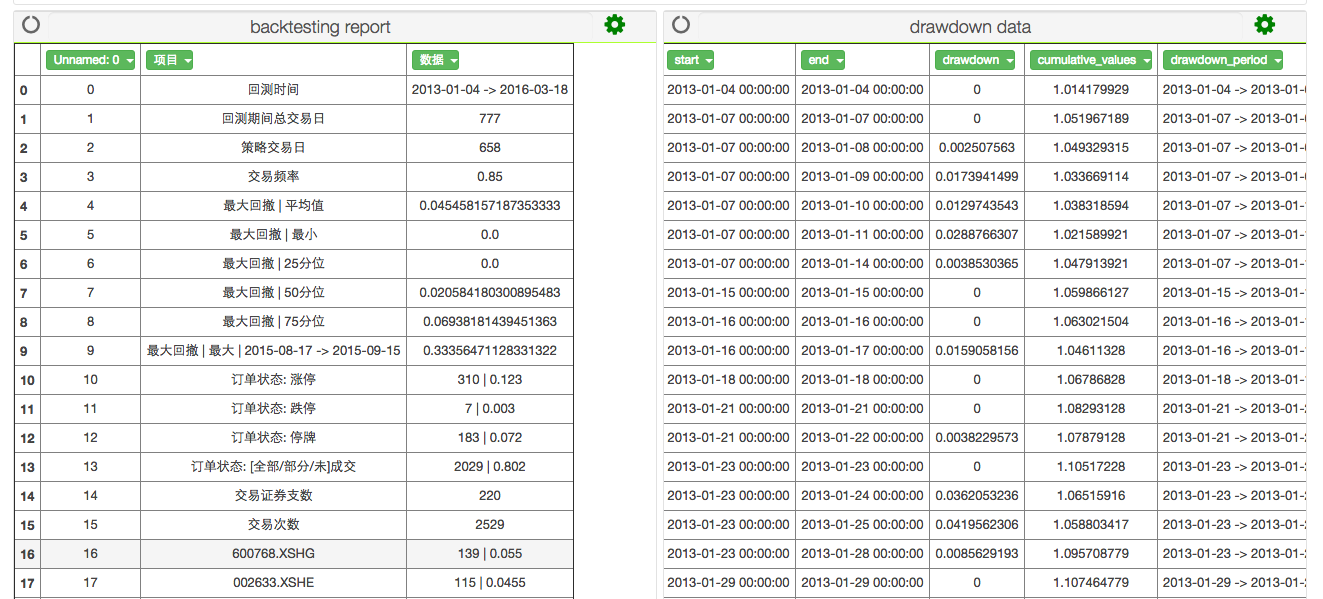
which looks like bellow:
Please check it here: http://litaotao.github.io/dynamic-charts-matplotlib-alternative-ipython-notebook-python-drawing-js
Thank you guys again, and if possible, please don't cancel your stars, ha~ha, any problems and questions when using the new method will get answered as long as you put it under that post.
thanks again, taotao~
Inspired by IPython, built with love
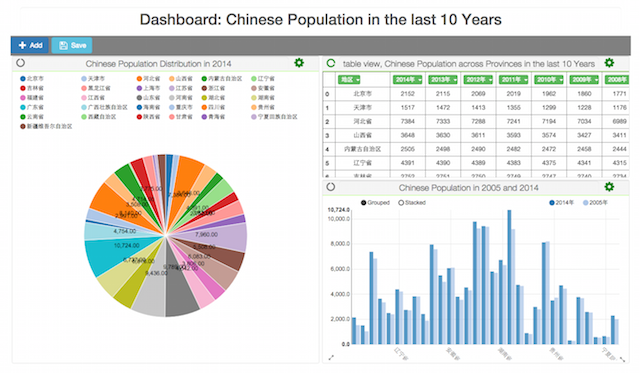
A stand alone, light-weight web server for building, sharing graphs created in IPython. Build for data science, data analysis guys. Aiming at building an interactive visualization, collaborated dashboard, and real-time streaming graph.
-
Install prerequisite
- install the latest stable IPython-Dashboard:
pip install ipython-dashboard --upgrade - install redis 2.6+ : install guide
- [
option, if you need run sql]install mysql :brew install mysqlorapt-get install mysql - install IPython-Dashboard requirements [unneeded sometimes]:
cd ~/your python package path/IPython-Dashboardpip install -r requirements.txt
- install the latest stable IPython-Dashboard:
-
[
option, if you need run sql]Config mysql-
start mysql server :
mysql.server start -
login in mysql using root :
mysql -u root -
create a user and grant privileges;
- take a look at current database user
mysql> SELECT User,Host FROM mysql.user; +------+-----------+ | User | Host | +------+-----------+ | root | 127.0.0.1 | | root | ::1 | | | localhost | | root | localhost | | | mac007 | | root | mac007 | +------+-----------+ 6 rows in set (0.00 sec)- create a user for IPython-Dashboard
mysql> create user 'ipd'@'localhost' identified by 'thanks'; Query OK, 0 rows affected (0.00 sec) mysql> grant all privileges on *.* to ipd@localhost; Query OK, 0 rows affected (0.00 sec) mysql> SELECT User,Host FROM mysql.user; +------+-----------+ | User | Host | +------+-----------+ | root | 127.0.0.1 | | root | ::1 | | | localhost | | ipd | localhost | | root | localhost | | | mac007 | | root | mac007 | +------+-----------+ 7 rows in set (0.00 sec) mysql> flush privileges; Query OK, 0 rows affected (0.00 sec) -
create tables;
nosetests -s dashboard.tests.testCreateData:test_create_mysql_data
-
-
Create logging path
- create a folder to store log files. I put it under
mntcurrently:/mnt/ipython-dashboard/logs - make sure the log folder is write-able, using
chmodandls -lto confirm.
chenshan@mac007:/mnt/ipython-dashboard$ls -l total 0 drwxrwxrwx 9 root wheel 306 Dec 15 22:09 logs - create a folder to store log files. I put it under
-
Config IPython-Dashboard server :
IPython-Dashboard/dashboard/config.pyapp_host='ip_address:port'
-
Start redis and IPython-Dashboard server
chenshan@mac007:~/Desktop/github/IPython-Dashboard$redis-server & chenshan@mac007:~/Desktop/github/IPython-Dashboard$dash-server --help usage: dash-server [-h] [-H HOST] [-p PORT] [-d DEBUG] Start your IPython-Dashboard server ... optional arguments: -h, --help show this help message and exit -H HOST, --host HOST server host, default localhost -p PORT, --port PORT server port, default 9090 -d DEBUG, --debug DEBUG server port, default true chenshan@mac007:~/Desktop/github/IPython-Dashboard$dash-server Namespace(debug=True, host='0.0.0.0', port=9090) * Running on http://0.0.0.0:9090/ * Restarting with reloader Namespace(debug=True, host='0.0.0.0', port=9090) -
Do your exploring
- IPython-Dashboard-Tutorial.ipynb : On nbviewer or On github
- support raw html visualization
- support python object visualization
- Editable
- Real-time fresh when rendering a variable python object
- Can be shared, both public and private [ need password ]
- In the notebook, can share an object to a dashboard [ that's visualize that object in that dashboard ]
- exploring in notebook, share/send the result/summary to people, without the details.
- share some data in a private notebook.
- disappointed with the complicated code when drawing a graceful/staic graph using matplotlib/seaborn/mpld3 etc.
- want an interactive graph, allow people to zoom in/out, resize, get hover tips, change graph type easily.
- want a real-time graph.
- want an collaborated graph/dashboard.
just run sudo nosetests --with-coverage --cover-package=dashboard under this repo
taotao@mac007:~/Desktop/github/IPython-Dashboard$sudo nosetests --with-coverage --cover-package=dashboard
Password:
../Users/chenshan/Desktop/github/IPython-Dashboard/dashboard/tests/testCreateData.py:69: Warning: Can't create database 'IPD_data'; database exists
  conn.cursor().execute('CREATE DATABASE IF NOT EXISTS {};'.format(config.sql_db))
/Users/chenshan/Desktop/github/IPython-Dashboard/dashboard/server/utils.py:135: Warning: Unknown table 'ipd_data.businesses'
  cursor.execute(sql)
/Library/Python/2.7/site-packages/pandas/io/sql.py:599: FutureWarning: The 'mysql' flavor with DBAPI connection is deprecated and will be removed in future versions. MySQL will be further supported with SQLAlchemy engines.
  warnings.warn(_MYSQL_WARNING, FutureWarning)
...
Name                                    Stmts   Miss  Cover   Missing
---------------------------------------------------------------------
dashboard.py                               13      0   100%
dashboard/client.py                         1      0   100%
dashboard/client/sender.py                 11      3    73%   26-27, 33
dashboard/conf.py                           0      0   100%
dashboard/conf/config.py                   29      0   100%
dashboard/server.py                         0      0   100%
dashboard/server/resources.py               0      0   100%
dashboard/server/resources/dash.py         35     10    71%   36, 55-56, 67-69, 86-89
dashboard/server/resources/home.py         40     12    70%   25, 28-30, 83-91
dashboard/server/resources/sql.py          27     11    59%   30, 52-75
dashboard/server/resources/status.py        8      1    88%   19
dashboard/server/resources/storage.py      13      5    62%   26-28, 43-47
dashboard/server/utils.py                  79     18    77%   20-24, 78-80, 82-83, 86, 96, 99-100, 126-127, 140-142
dashboard/server/views.py                  21      1    95%   16
---------------------------------------------------------------------
TOTAL                                     277     61    78%
----------------------------------------------------------------------
Ran 5 tests in 9.885s

OK
taotao@mac007:~/Desktop/github/IPython-Dashboard$
-
future
- front side, databricks style
- pep 8, code clean up & restructure
- hover tips
- edit modal can be resized
- Share one graph
- Share one dashboard
- Presentation mode
- footer
- unified message display center
- SQL Editor
- login management
- unified logger and exception report
- server side log
- client side log
- support python3
- create examples
- render sql in dashboard
- chart optimize
-
V 0.1.6 : optimize-chart [ current develop version ]
-
Dashboard
- re-structure code, follow pep8 style
- create 1 example
- optimize chart
-
SQL Editor
- optimize page
- render sql result as graph
-
-
V 0.1.5 : sql-server-log [ current stable version ]
-
Dashboard
- create 1 example
- server side log
- support x-axis as date format
- research on real-time updated dataframe
-
SQL Editor
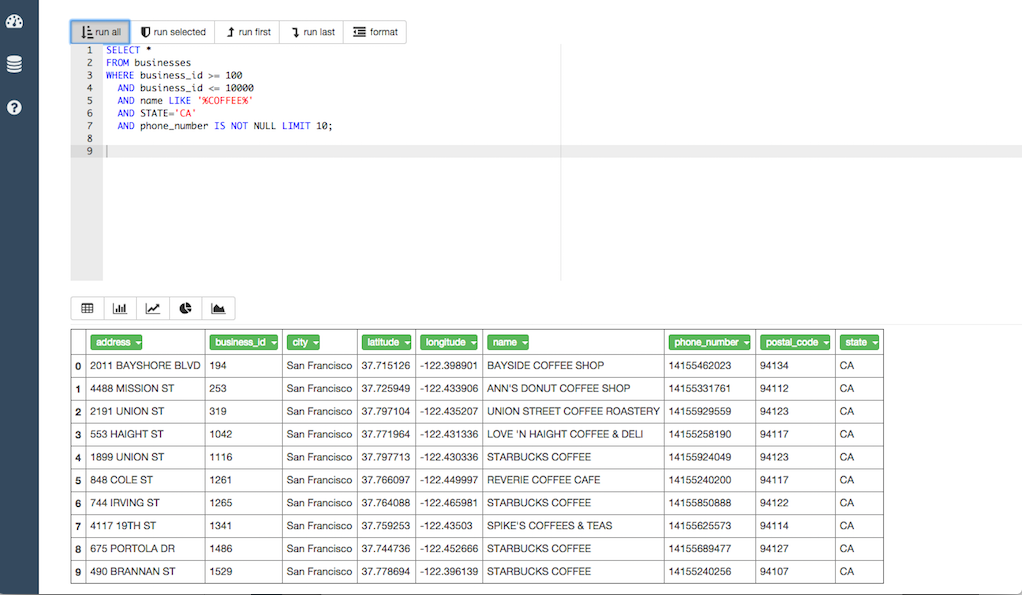
- sql server develop : render sql result as table view
-


