This README provides a comprehensive guide on setting up the Dev Portfolio project, showcasing robust DevOps practices. The project involves provisioning an AWS EKS cluster using Terraform, implementing a CI/CD pipeline with GitHub Actions, Docker, Kubernetes, and Argo CD, and ensuring security best practices are followed.
- Overview
- Setup Overview
- Prerequisites
- Setup Instructions
- Workflow Steps
- Monitoring and Visualization
- Cost Management
The Dev Portfolio project focuses on creating a portfolio website. This README guides you through setting up the project's infrastructure, implementing a robust CI/CD pipeline, and ensuring security measures are in place.
This website is Designed/Created by Adrian Hajdin.

The Dev Portfolio project is built using a variety of tools and technologies to ensure robust development, deployment, and monitoring practices. Here's a list of the key technologies and tools used:
This selection of tools and technologies collectively highlights a modern approach to DevOps practices, encompassing development, deployment, security, and monitoring.
project.dev-portfolio_4.mp4
Before you begin, ensure you have the following:
- AWS account
- Terraform installed
- Docker Hub account
- GitHub account
- Slack account (for notifications)
- Clone the project repository:
git clone https://github.com/Saurabhkr952/dev-portfolio.git - Navigate to the
terraformdirectory:cd dev-portfolio/terraform - Modify the Terraform configuration files to match your environment.
- Run
terraform initandterraform applyto provision the EKS cluster.
To set up the workflow, follow these steps and modify the appropriate lines in the provided workflow file (./.github/workflows/multi-stage-workflow.yml):
-
Build and Push Docker Image Job: Navigate to the
buildjob section and make the following changes:- Line 17: Replace
saurabhkr952/dev-portfoliowith your desired image name.
- Line 17: Replace
-
Container Vulnerability Check Job: Navigate to the
scan_uploadjob section and make the following change:- Line 29: Replace
'docker.io/saurabhkr952/gdev-portfolio'with your image name.
- Line 29: Replace
-
Update Manifest Job: Navigate to the
update_manifestjob section and make the following changes:- Line 62: Replace
saurabhkr952/dev-portfolio-manifestwith your manifest repository name. - Line 42: Replace
saurabhkr952/dev-portfoliowith the appropriate image reference. - Line 67: Replace
[email protected]with your GitHub Gmail. - Line 68: Replace
saurabhkr952with your GitHub username. - Line 70: Replace
saurabhkr952/dev-portfoliowith your docker image at both place. & also replacedeployment.yamlwith filename.yaml with path. - Line 77: Replace
saurabhkr952/dev-portfolio-manifestwith your manifest repository. name.
- Line 62: Replace
-
Slack Workflow Status Job: Navigate to the
slack-workflow-statusjob section and make the following changes:- Line 96: Replace
#generalwith your channel name.
- Line 96: Replace
To add the necessary secrets, follow these steps:
- Go to the repository settings.
- Under the security settings, access the 'Secrets and Variables' section.
- Inside the 'Secrets and Variables' section, proceed to the 'Actions' subsection.
- Add the following repository secrets:
DOCKERHUB_USERNAME: Your DockerHub username.DOCKERHUB_TOKEN: Your DockerHub password.PAT_TOKEN: Your GitHub Personal Access Token.SLACK_WEBHOOK_URL: Your Slack webhook URL. Refer to this guide on how to obtain the URL.
Refer to the official Argo CD documentation to install Argo CD on your EKS cluster.
Here's how the CI/CD pipeline works:
-
Developers push code to the GitHub repository.
-
GitHub Actions automatically triggers a workflow when new code is pushed.
-
The workflow starts by building the Docker image and then pushing it to DockerHub.
-
After the Docker image is successfully pushed, the workflow scans the container for vulnerabilities.
-
Following the vulnerability scan, the workflow updates the Kubernetes manifests in the Git repository with the new image tag.
-
Argo CD continuously monitors the Git repository and updates the application version in the Kubernetes cluster.
-
Security vulnerabilities are reported and can be reviewed in the security tab.

-
After the workflow is successfully completed, the status is reflected as shown below:

-
Notifications are sent to Slack to provide information about the workflow status.

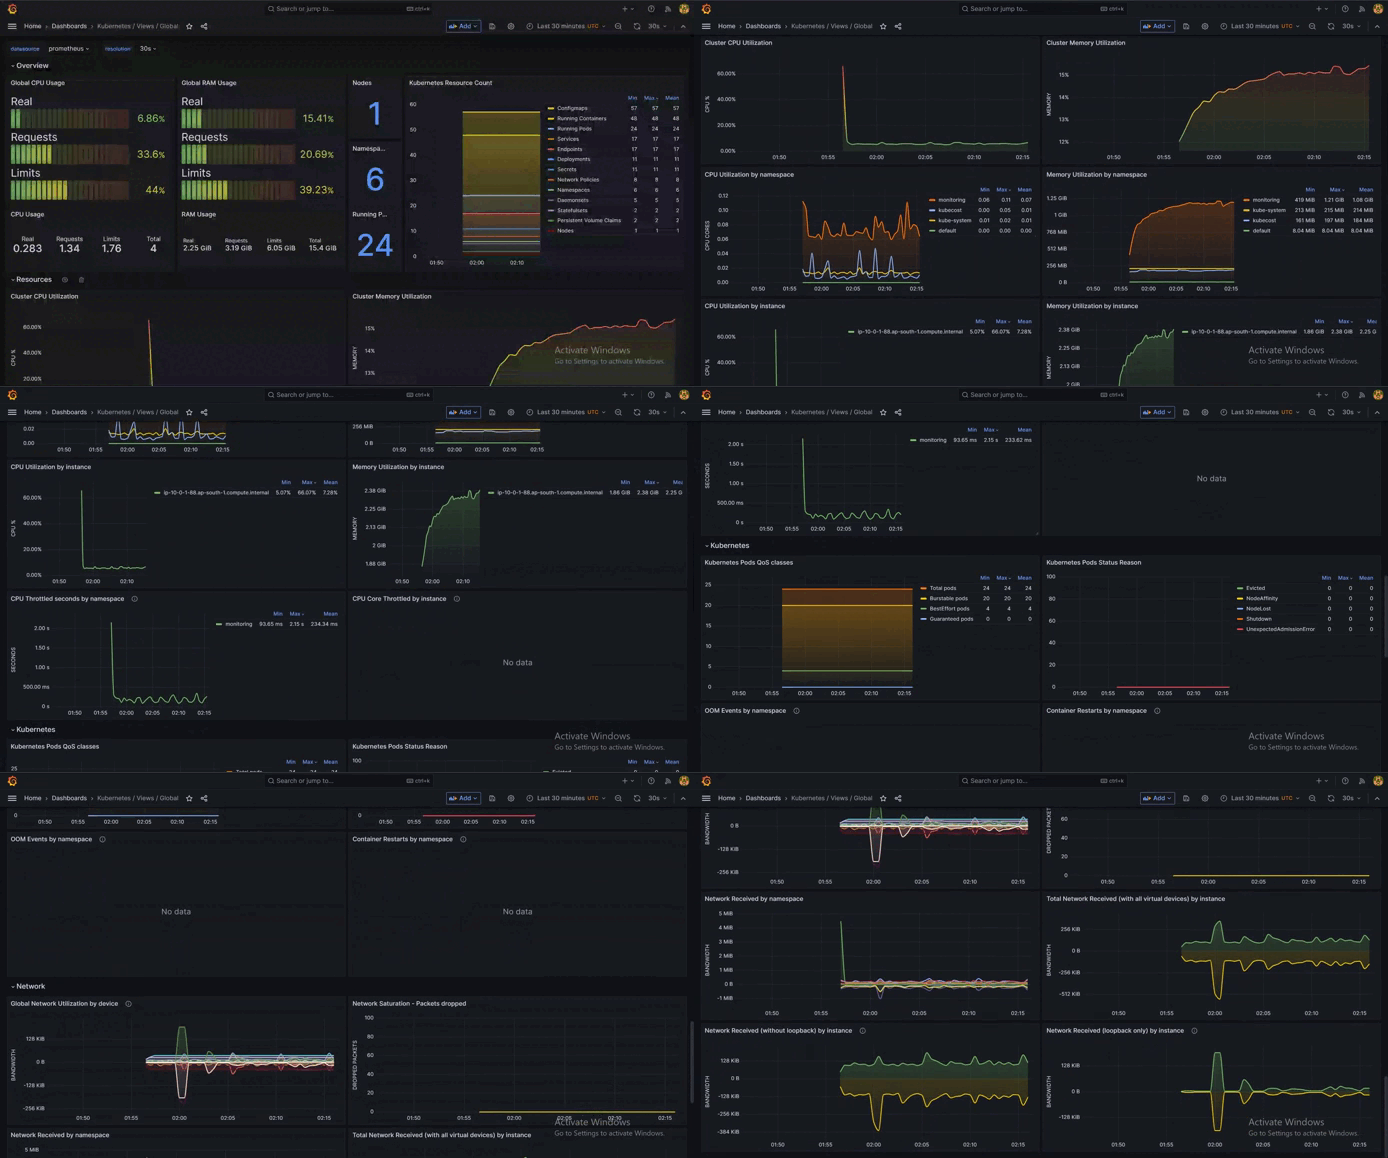
Prometheus and Grafana. Prometheus serves as the data source for Grafana, enabling the visualization of metrics and performance data. A Grafana dashboard is employed to monitor the Kubernetes cluster using data collected by Prometheus.
Here's a preview of a Grafana dashboard monitoring the Kubernetes cluster:
Kubecost is used for Kubernetes cost allocation and resource management.
Kubernetes Manifest Repository: dev-portfolio-manifest
Note: This project is currently a work in progress. Certain sections are being actively developed and will be updated soon. The following enhancements are planned:
- Detailed instructions on setting up Prometheus and Grafana for monitoring.
- A guide on setting up Kubecost for Kubernetes cost management.
- An updated CI/CD pipeline diagram with the latest changes and practices.


