Appium Desktop is an open source app for Mac, Windows, and Linux which gives you the power of the Appium automation server in a beautiful and flexible UI. It is a combination of a few Appium-related tools:
- A graphical interface for the Appium Server. You can set options, start/stop the server, see logs, etc... You also don't need to use Node/NPM to install Appium, as the Node runtime comes bundled with Appium Desktop.
- An Inspector that you can use to look at your app's elements, get basic information about them, and perform basic interactions with them. This is useful as a way to learn about Appium or as a way to learn about your app so you can write tests for it.
You can always pick up the latest release at our Release page on GitHub.
If you're on Windows or macOS, Appium Desktop will automatically provide you with updated versions of the app when they are released. If you encounter a problem updating, simply delete or uninstall the app and re-download the latest from the link above.
Note that Appium Desktop is not the same thing as Appium. Appium Desktop is a graphical frontend to Appium with additional tools. Appium Desktop is released on its own cadence and has its own versioning system. If you are reporting an issue with Appium Desktop, always be sure to include both the version of Appium Desktop and the version of the Appium Server which is in use (see below).
If you're on macOS, you will need to install Appium Desktop by copying the app from the downloaded DMG file to your own file system (the best place is the "Applications" folder). Running Appium from in side the attached DMG itself is not supported, and will not work.
- Auto updater is not working (https://github.com/appium/appium-desktop/issues/74)
These instructions assume you are already familiar with Appium and Appium-related concepts. If you are new to Appium, please visit appium.io and read our introductory material.
This app provides a convenient way to download and run the Appium automation server, as well as a tool for inspecting your Android or iOS application. Its various capabilities are described in the following sections.
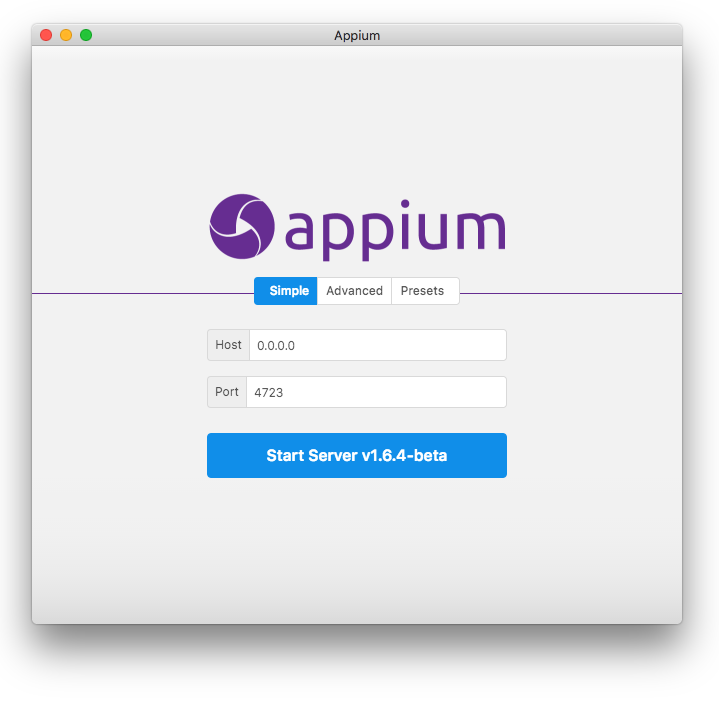
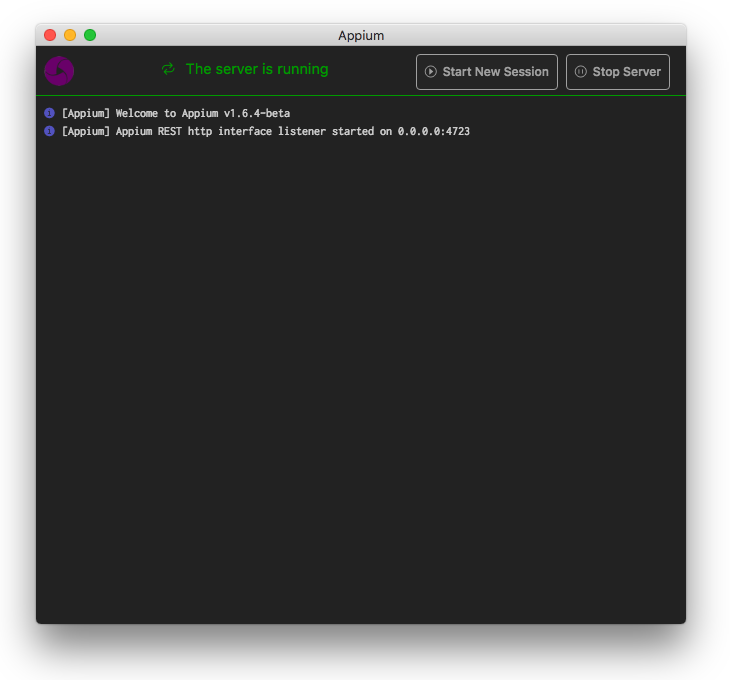
When you open Appium Desktop, you are greeted with the server start window. The basic option is to start an Appium server with all its defaults and the ability to modify the host and port. The start button will also let you know which version of the Appium server you are running, which can be useful when reporting issues to the Appium team.
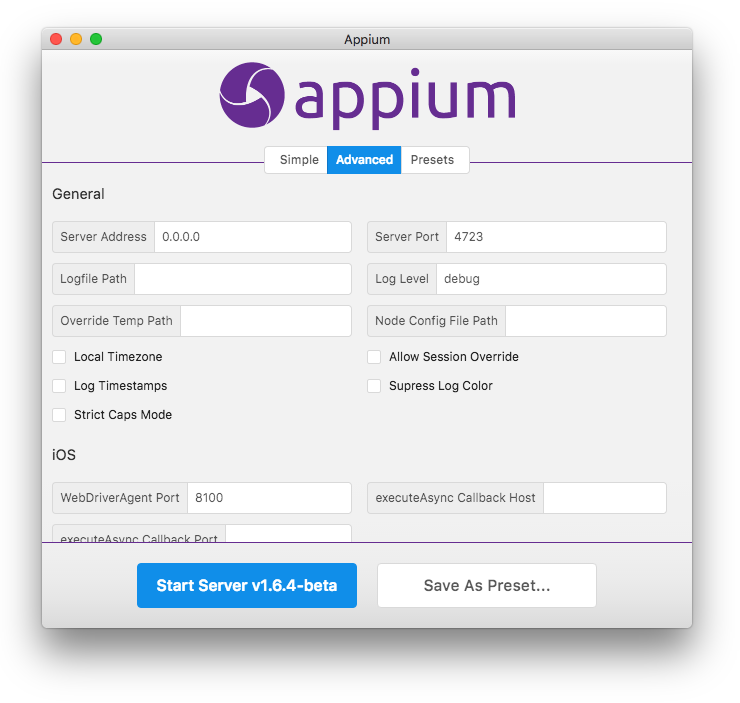
By clicking on the 'Advanced' tab, you have the ability to set all the server flags that are available in Appium. This is for advanced users and should only be modified after consulting the Appium documentation.
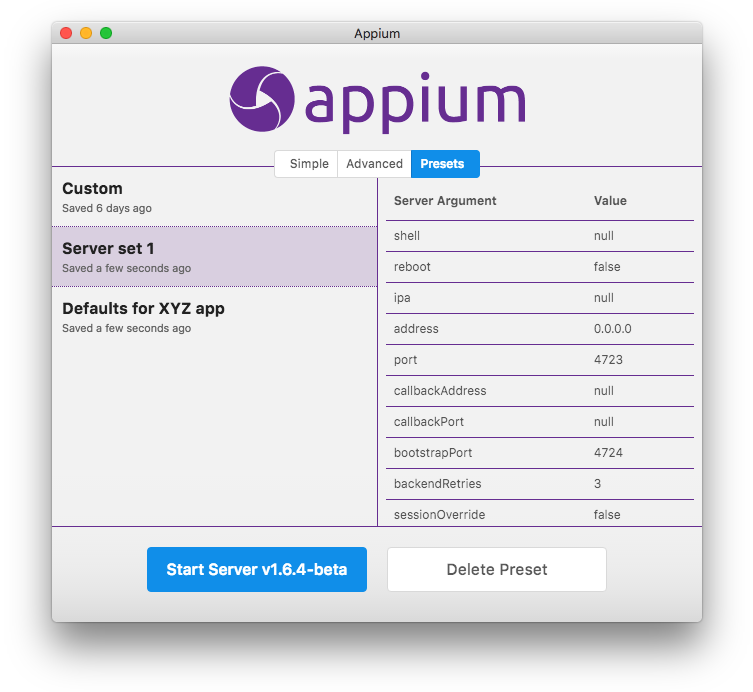
If you use the advanced server options, you have the ability to save a configuration for later use. Simply save the preset on the 'Advanced' tab, and you will subsequently be able to recall and start the server with that configuration from the 'Preset' tab.
Once you start the server, it will launch on the host and port you specified, and open a new window displaying the server log output.
This is fairly straightforward and no real interaction is possible, beyond using the button to stop the server. You can also copy-and-paste the logs from this window which is useful in reporting Appium issues.
One other button is available: 'Start New Session'. Clicking this will open up the New Session window enabling you to start an Inspector session on the currently-running server.
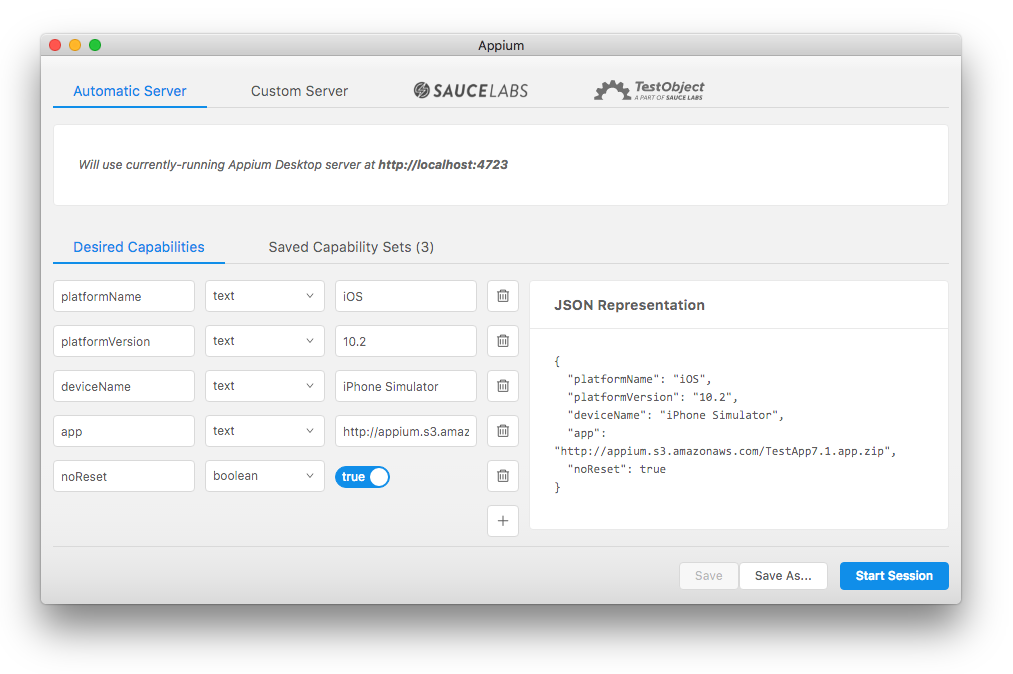
The New Session window allows you to construct a set of Appium desired capabilities used to launch an Appium session. You can launch a session against the currently-running Appium Desktop server (which is the default), or you can launch a session against a variety of other endpoints.
Since it's not required to run against Appium Desktop's own server, you can get to the New Session window without starting an Appium Desktop server. Simply go to "File" (Windows/Linux) or "Appium" (Mac) and choose "New Session...", which will open the New Session window without having to start a local server. In this case, attaching to the local server will be disabled.
These are the options for launching a session against a non-local Appium server:
- A custom host/port configuration: this is useful if you want to launch an Inspector session against an Appium server running on another machine in your network, for example.
- Sauce Labs: if you don't have access to, say, iOS simulators on your machine, you can leverage your Sauce Labs account to start an Appium session in the cloud.
- TestObject: you can also utilize TestObject's cloud of real devices for a real device-based Inspector session.
It should be straightforward to get set up with any of these options. Simply enter your details in the input fields provided.
Desired capabilities are how you configure your Appium session. They tell the Appium server what kind of platform and app you want to automate. If you are unfamiliar with the concept of desired capabilities, or which desired capabilities are required to launch Appium sessions of various types, you should consult the Appium documentation.
Appium Desktop does not restrict your creation of desired capabilities in any way, nor will it validate them for you. It simply provides a nice UI for entering them in, and saving them for later use. Under the 'Desired Capabilities' tab, you can use the form fields and '+' button to enter as many desired capabilities as you need. You will also see a representation of the resulting JSON, which is what is actually sent to the Appium server. This can be useful for verifying your capabilities, or for copy-and-pasting when reporting issues.
Once you have set your desired capabilities, you might wish to save them so you can run the same type of session later. Simply click the 'Save As...' button to give your capability set a name. You can then access it under the 'Saved Capability Sets' tab, for later editing or session launching.
Once your server type and capabilities are set, click 'Start Session' to launch the Appium Desktop Inspector.
If you click on the "Attach to Session..." tab, you can select an existing session from a list of currently running sessions on your selected server, or you can input a session ID of a currently-running session. That session should be running on the server details you specified in the server type section above. Attaching to an existing session is possible because the Inspector is just an Appium client. This could be useful if you want to debug the middle of a running test. When you quit the Inspector window of an existing session, Appium Desktop will not quit the session as it does normally.
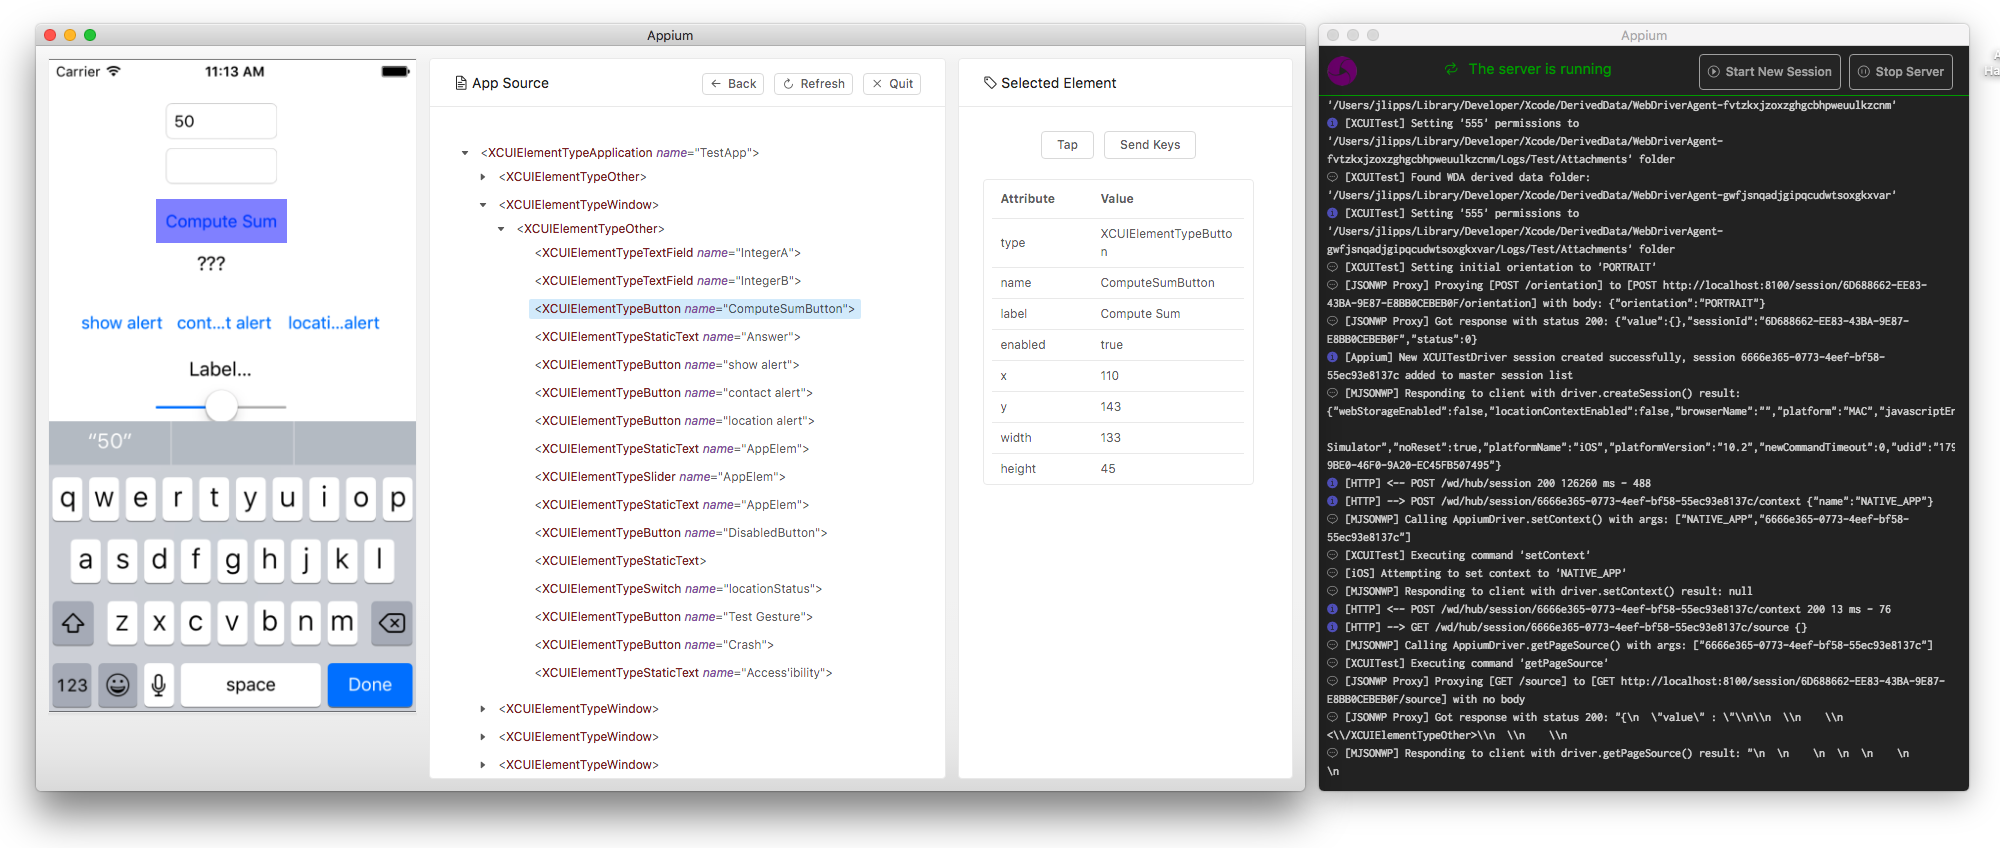
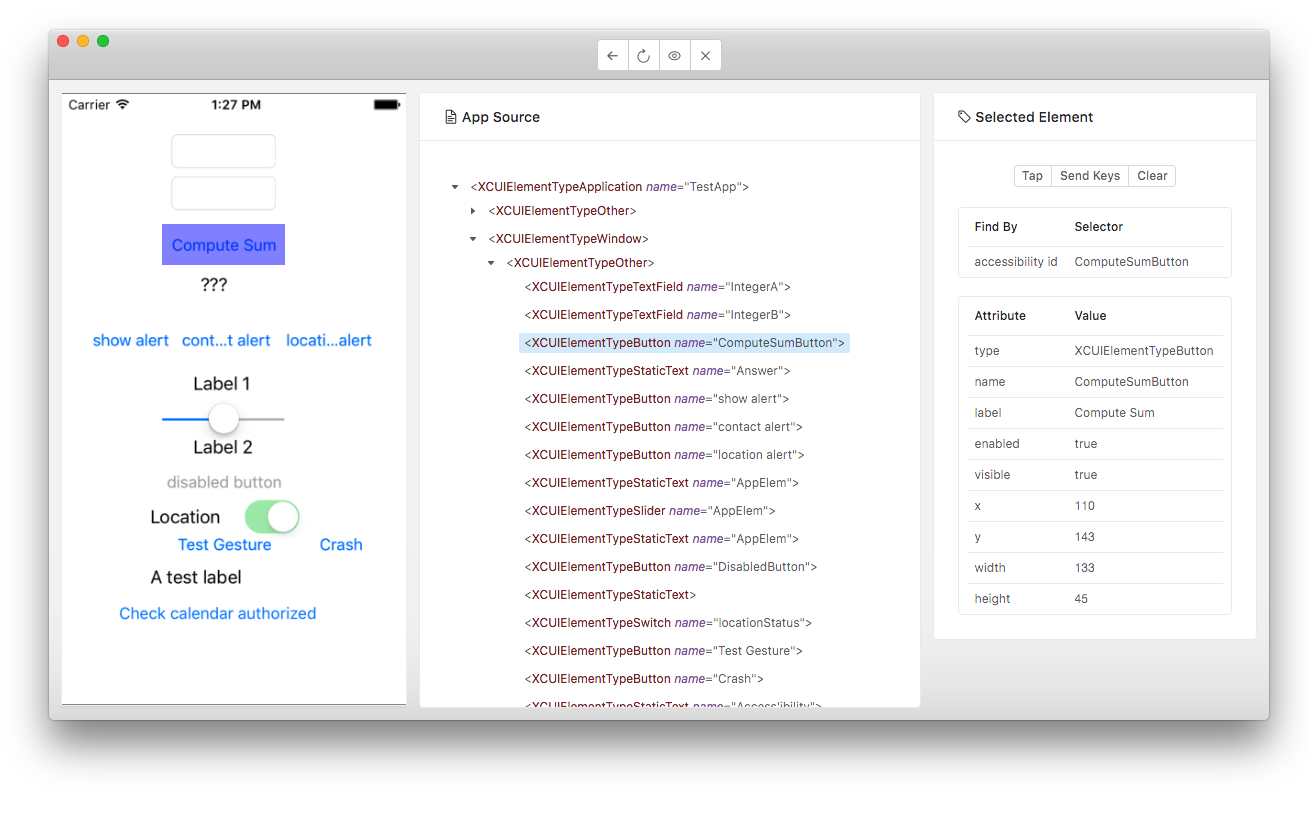
The Inspector is a visual representation of the state of your application along with the ability to perform certain interactions in your application through Appium.
Appium sessions can take some time to load, especially on cloud services, so please be patient. When the session loads, a screenshot of your app will appear on the left. You can mouse over various UI elements in your application, and see them highlighted.
In the middle of the Inspector window is your app's hierarchy, represented as XML. You can navigate this tree by clicking through it, or by clicking on elements in the screenshot view. They will then be highlighted.
When an element is highlighted, its information will appear in the detail view on the right side of the Inspector. This detail view consists of potential actions to take against the element, and a table of the element's properties. These properties are valuable in determining how the element might accessed using a particular Appium locator strategy. With an element selected, you can also 'Tap' the element, or 'Send Keys' to the element (if it is a text field).
When you take such an action with an element, the Inspector will send the command to Appium, which will execute it. If the action is successful, a new screenshot will be generated and you should see the updated state and XML of your app. If it's not successful, you'll have an opportunity to see the error message.
The top of the Inspector window contains a small toolbar with icons representing the ability to take certain actions in the Inspector:
- Back (call
driver.back) - Refresh (refresh the source and screenshot)
- Start Recording (open the recorder, see the next section for more information on the recorder)
- Quit the session (call
driver.quitand close the Inspector)
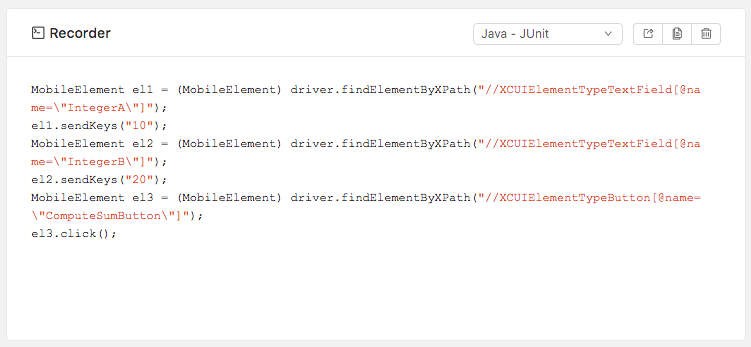
Appium Desktop comes with a very basic action recorder, that watches for actions taken using Appium Desktop and displays language-and-framework-specific code that represents those actions. The code can then be copied-and-pasted into the appropriate Appium client code and used for tests.
NB: the goal of the Recorder is not to produce production-ready test code. It is designed as a tool to help explore the Appium API, and demonstrate how certain automation behaviors correspond to method calls in a particular language and Appium library. In sum, it is a learning tool, not a robust code generation feature, and should be used as such.
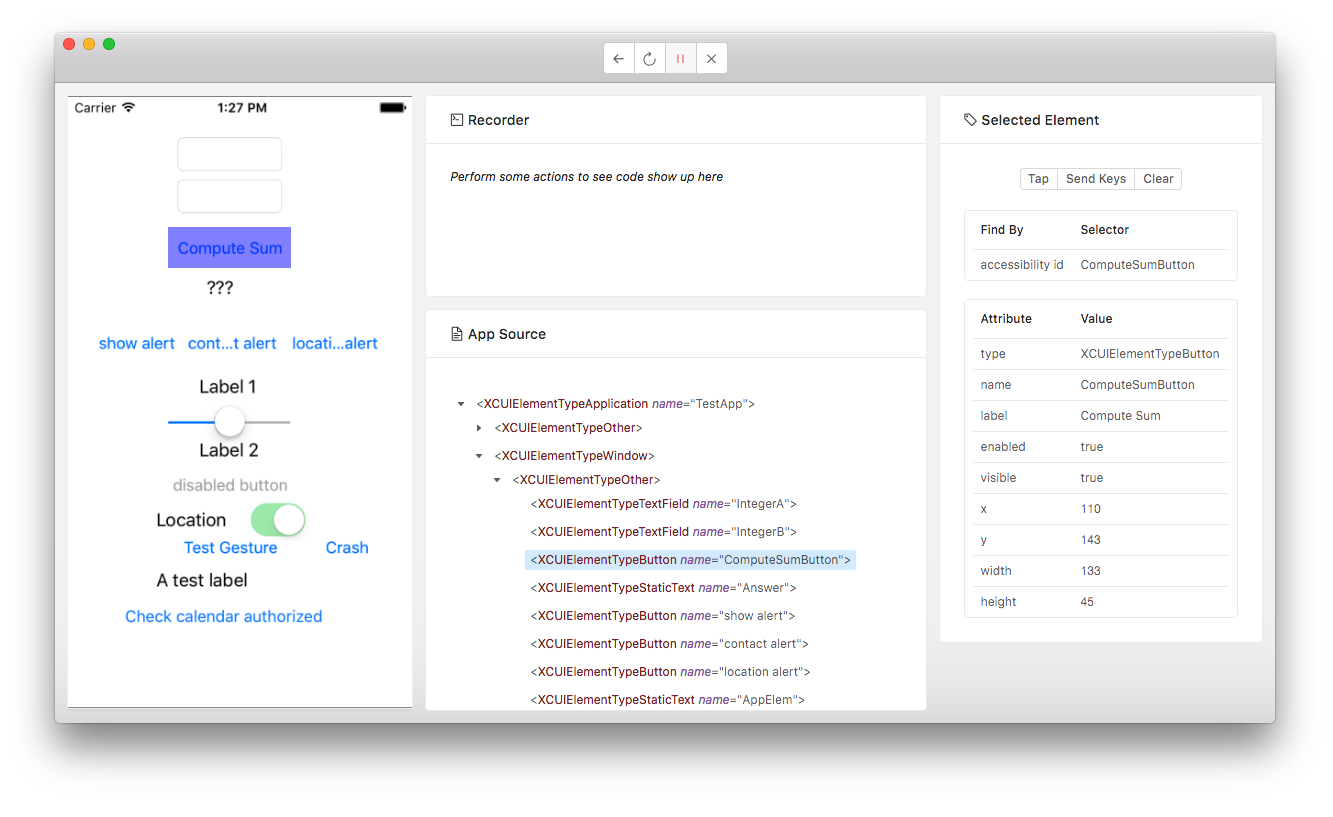
When you start recording, the Inspector will show an additional window:
At first, the Recorder will show no code. You will first have to take some action, like finding an element in the hierarchy and tapping on it, or sending keystrokes to it. When you do this, code will appear in the recorder window, corresponding to the particular language and framework you have chosen (which can be adjusted in the drop-down menu at the top right of the Recorder):
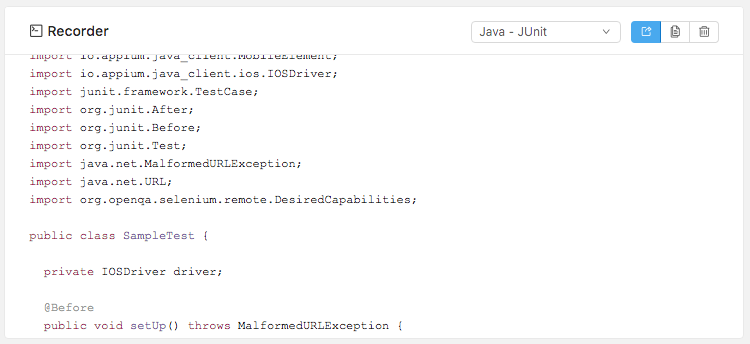
This code can be copied to your clipboard using the appropriate button at the top right of the Recorder pane. Note that by default what is shown are simply lines of code corresponding to the specific actions you have taken while recording---in general you cannot paste these lines into an empty text file and run the code. To run Appium test scripts in code requires that various dependencies (like the Appium client libraries) be installed, and that script boilerplate (like instantiating a driver and initializing a session) be present. To show this additional code, you can click the "Show Boilerplate" button. With boilerplate code shown, it is possible to copy and paste the code into a new file and run it.
The power of the Recorder will continue to grow as we add more languages, frameworks, and actions to Appium Desktop.
This is everything you need to know to use Appium Desktop successfully! Remember, Appium Desktop is not a replacement for understanding Appium itself---it is simply a convenient tool for working with Appium on your desktop, and an Inspector for exploring your app. Have fun!
Appium Desktop is open source, and we use GitHub for issue tracking. Please simply report issues at our issue tracker. We will endeavor to determine whether the issue you are reporting is related to Appium Desktop or Appium Server. If it's not related to Appium Desktop specifically, we will close the issue and ask you to open a general Appium issue at Appium's main issue tracker. Please, save yourselves and us valuable time by getting clear on whether the issue you're experiencing is related to Appium Desktop specifically or instead is a general Appium issue. You can do this by seeing whether the issue reproduces with the Appium command line server as well. If it does, direct your report to Appium's issue tracker.
Have a feature request? Follow the same process and submit an issue to the appropriate tracker! (Either here in this repo if the request is specifically for Appium Desktop, or Appium's main tracker if the request is for Appium more generally.)
Appium uses environment variables like ANDROID_HOME as well as relying on
various binaries in your PATH and so on. When running from the command line
in an environment where you have set these variables appropriately, Appium has
no problem in picking them up. However, Appium Desktop does not run in a shell
or a command-line environment, and so by default it does not have access to
environment variables you have set in your shell startup script or profile. To
work around this, we use the
shell-env package to pick up
environment variables defined in your shell. This package only looks in certain
common init scripts, however, like ~/.bashrc, ~/.bash_profile, and
~/.zshrc. If you set your Appium environment variables in some other way, you
will need to create one of these default init scripts and set your environment
variables there as well, so that Appium Desktop will successfully pick them up.
This probably means you tried to launch Appium Desktop from the downloaded disk
image (.dmg file). This is not a supported mode of running Appium Desktop. To
correctly install Appium Desktop, copy the application from the disk image to
your local filesystem, to somewhere like /Applications. Then, run the app
from that new location.
Want to hack on Appium Desktop? Awesome! Head on over to our Contributing Doc for information on how to get a dev environment set up and submit changes back to the project.
