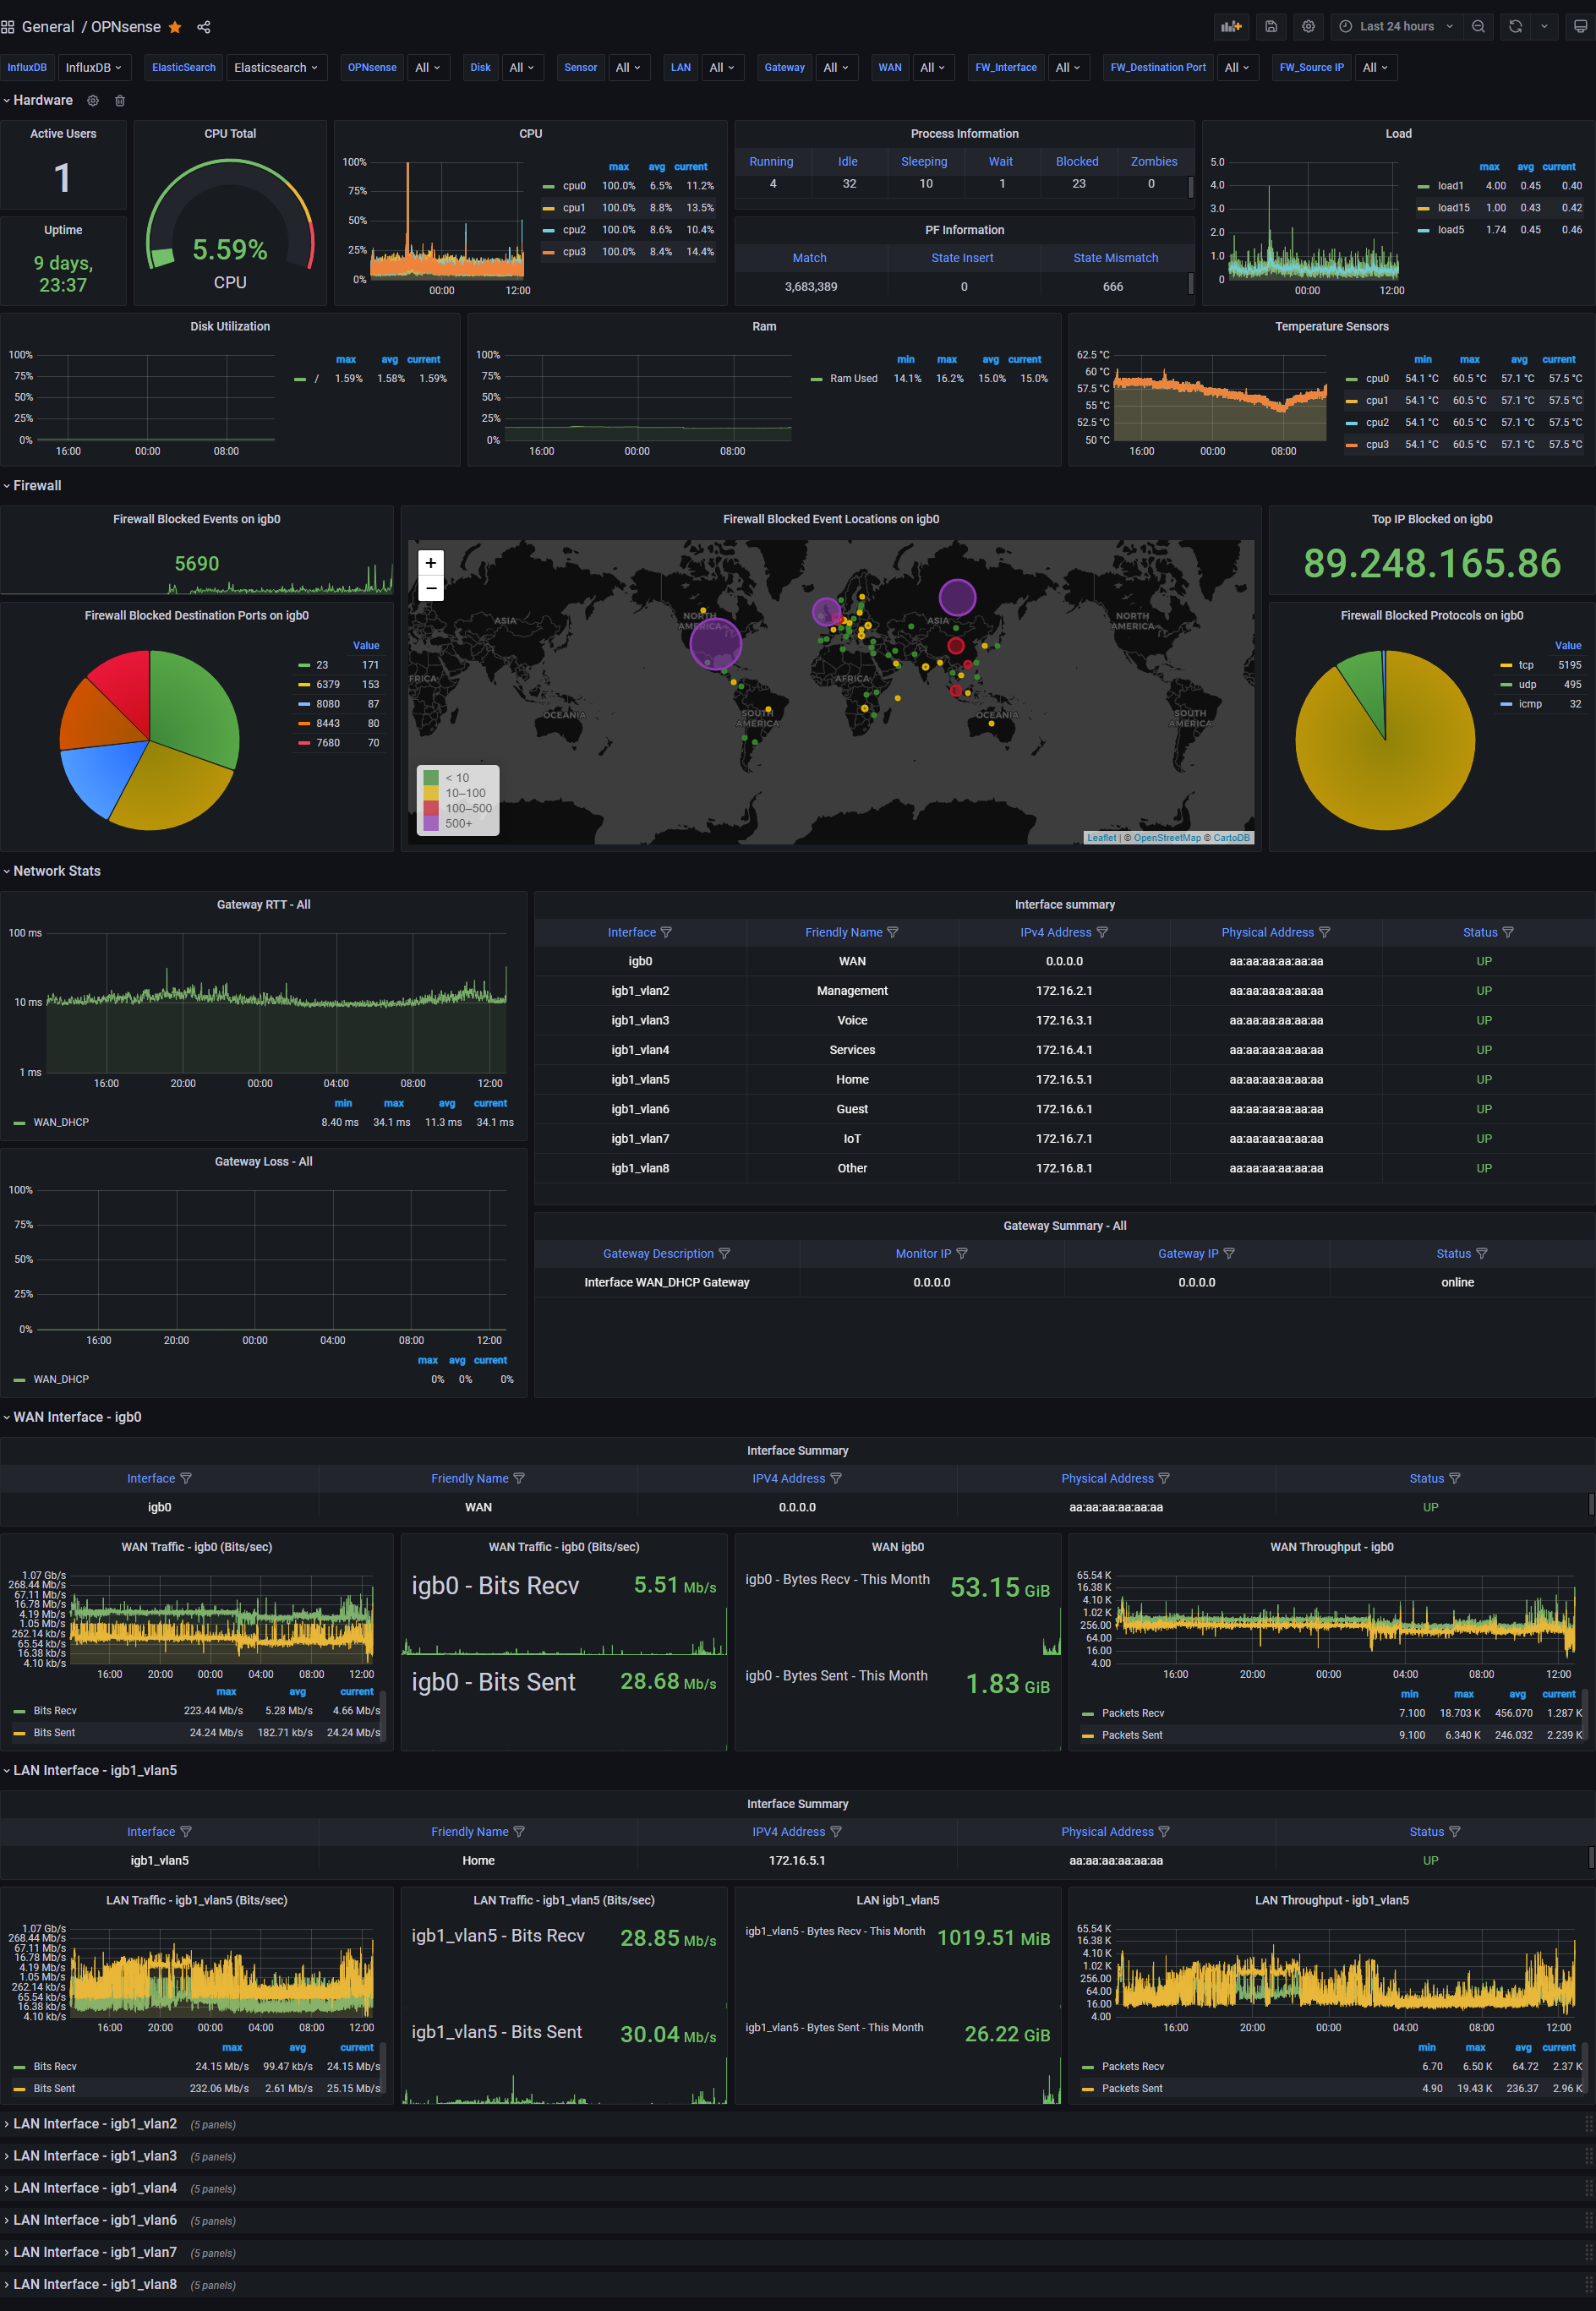
- Active Users
- Uptime
- CPU Load total
- Disk Utilization
- Memory Utilization
- CPU Utilization per core (Single Graph)
- Ram Utilization time graph
- Load Average
- Load Average Graph
- CPU and ACPI Temperature Sensors
- Gateway Response time - dpinger
- List of interfaces with IPv4, IPv6, Subnet, MAC, Status and pfSense labels thanks to /u/trumee
- WAN Statistics - Traffic & Throughput (Identified by dashboard variable)
- LAN Statistics - Traffic & Throughput (Identified by dashboard variable)
- Firewall Statistics - Blocked Ports, Protocols, Events, Blocked IP Locations, and Top Blocked IP
Converted InfluxQL queries to Flux.
Converted pfSense functions to OPNsense.
Added Firewall panels.
Added subnet info to Interface Summary panels
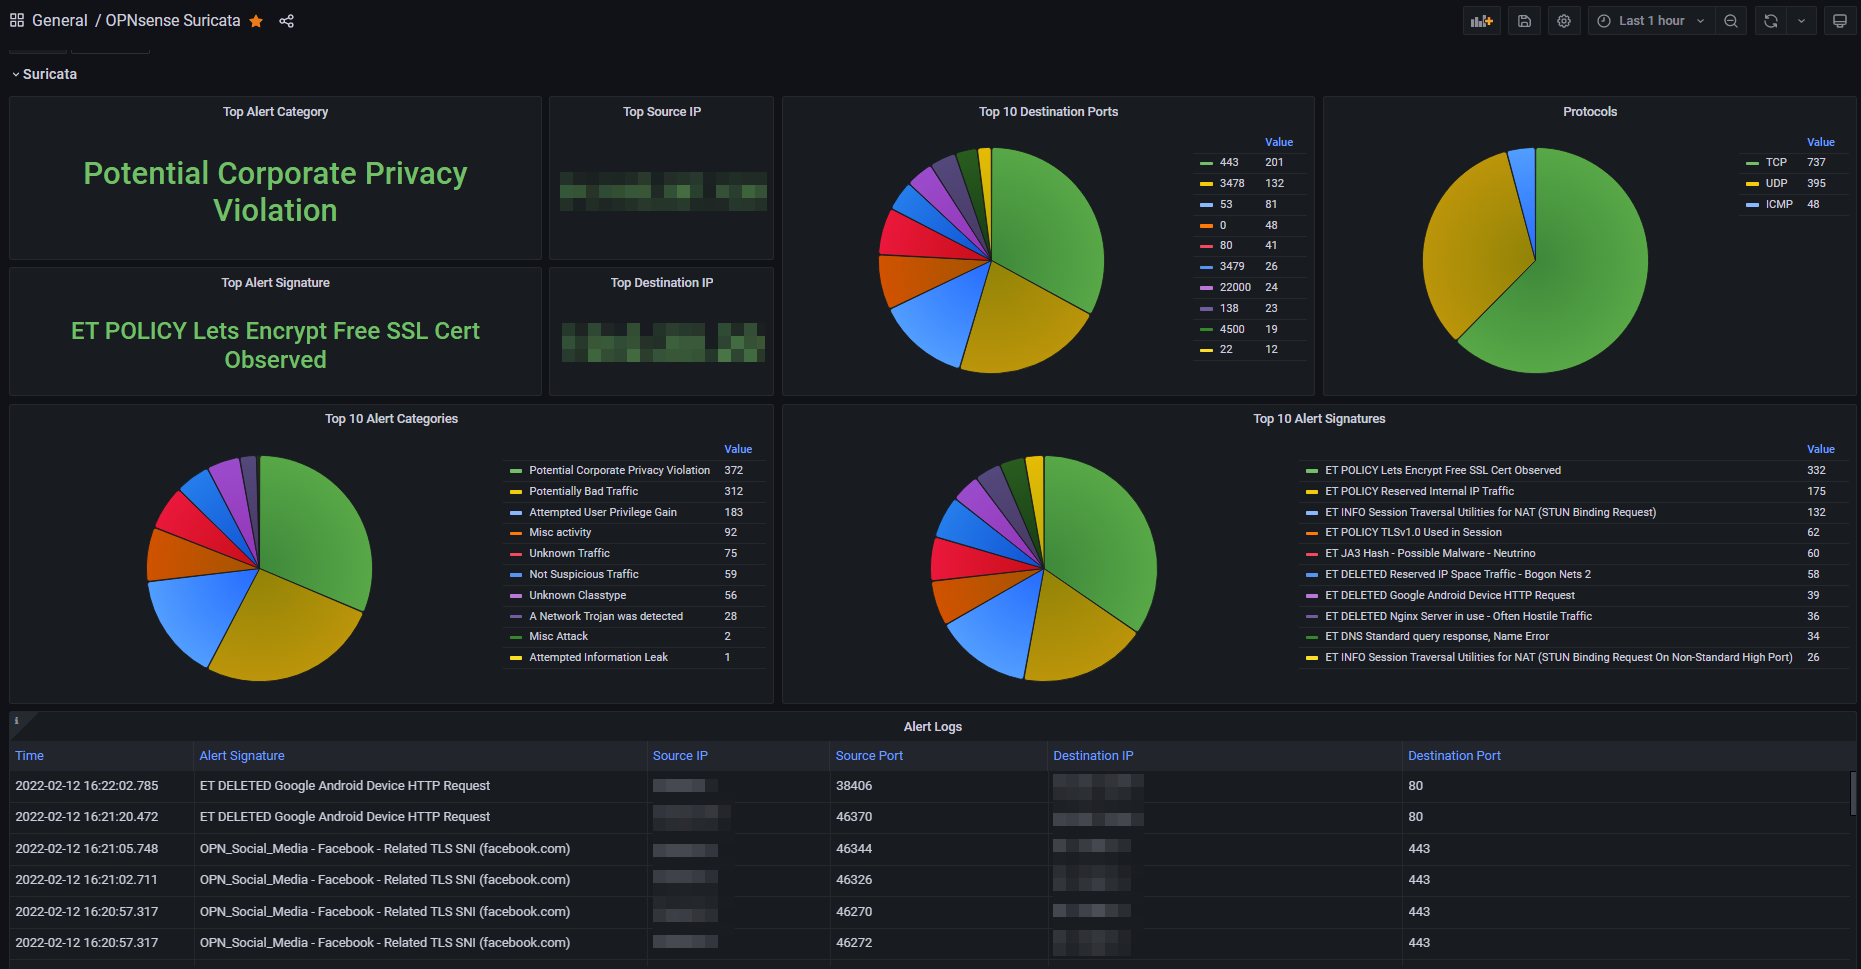
Added Suricata dashboard, see instructions here
Added RFC5424 support thanks to subract
Grafana 9.2.10
InfluxDB 2.6.1
Graylog 5.0.2
Configuration instructions can be found here.

