Monitore your websites availability, http status code (current and history), certificate, redirects and more with
git clone [email protected]:mbelloiseau/website-monitoring.git && cd website-monitoring- Edit
config/prometheus/targets.yml(see targets.yml.example) or use./gen_target.sh website-1.tld website-2.tld ... - Create and start containers
docker-compose up -d - Visualize dashboards
If you already have Prometheus and Prometheus blackbox exporter up and running just import the dashboards (website-monitoring or overview) and use the right datasource and jobs (http_job and icmp_job)
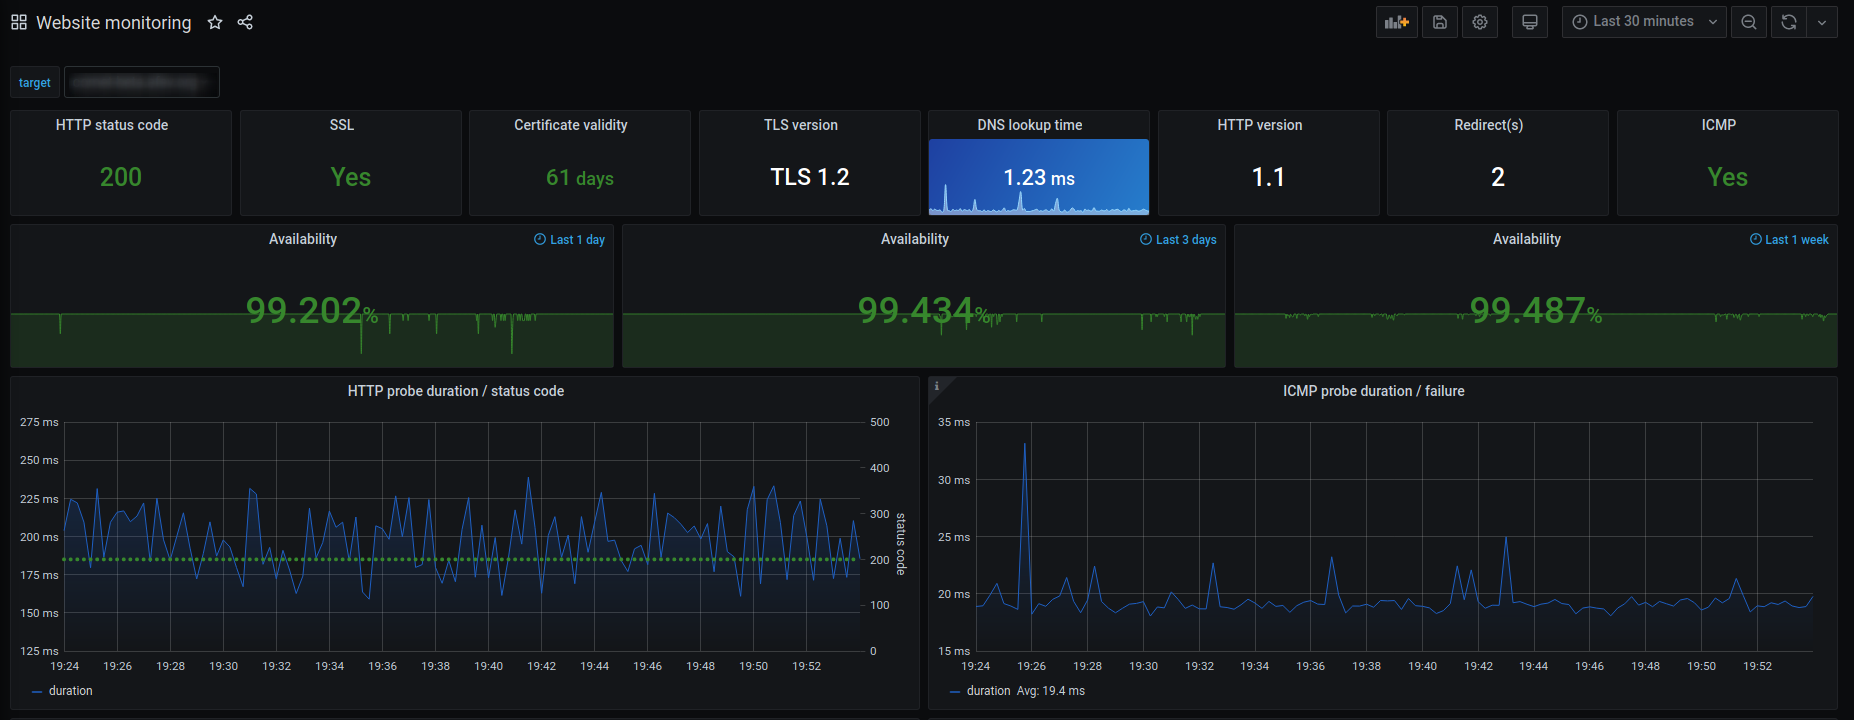
- HTTP status code
- HTTP redirects
- HTTP version
- TLS version
- Certificate validity
- ICMP
- DNS lookup time
- Availability over the last 24 hours, 3 days and 7 days
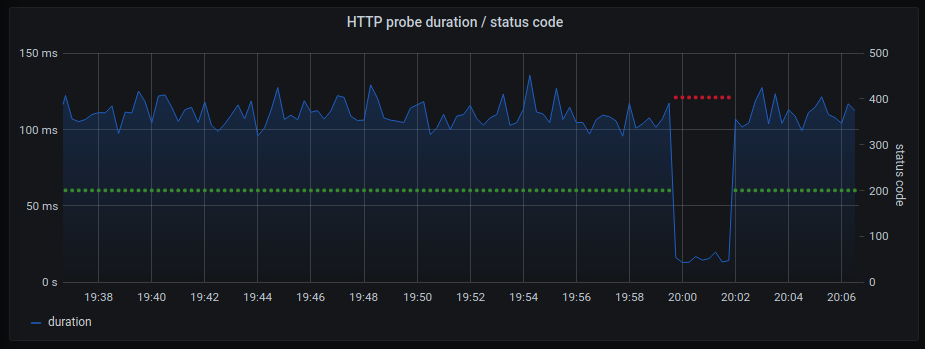
- Probe duration and status code history
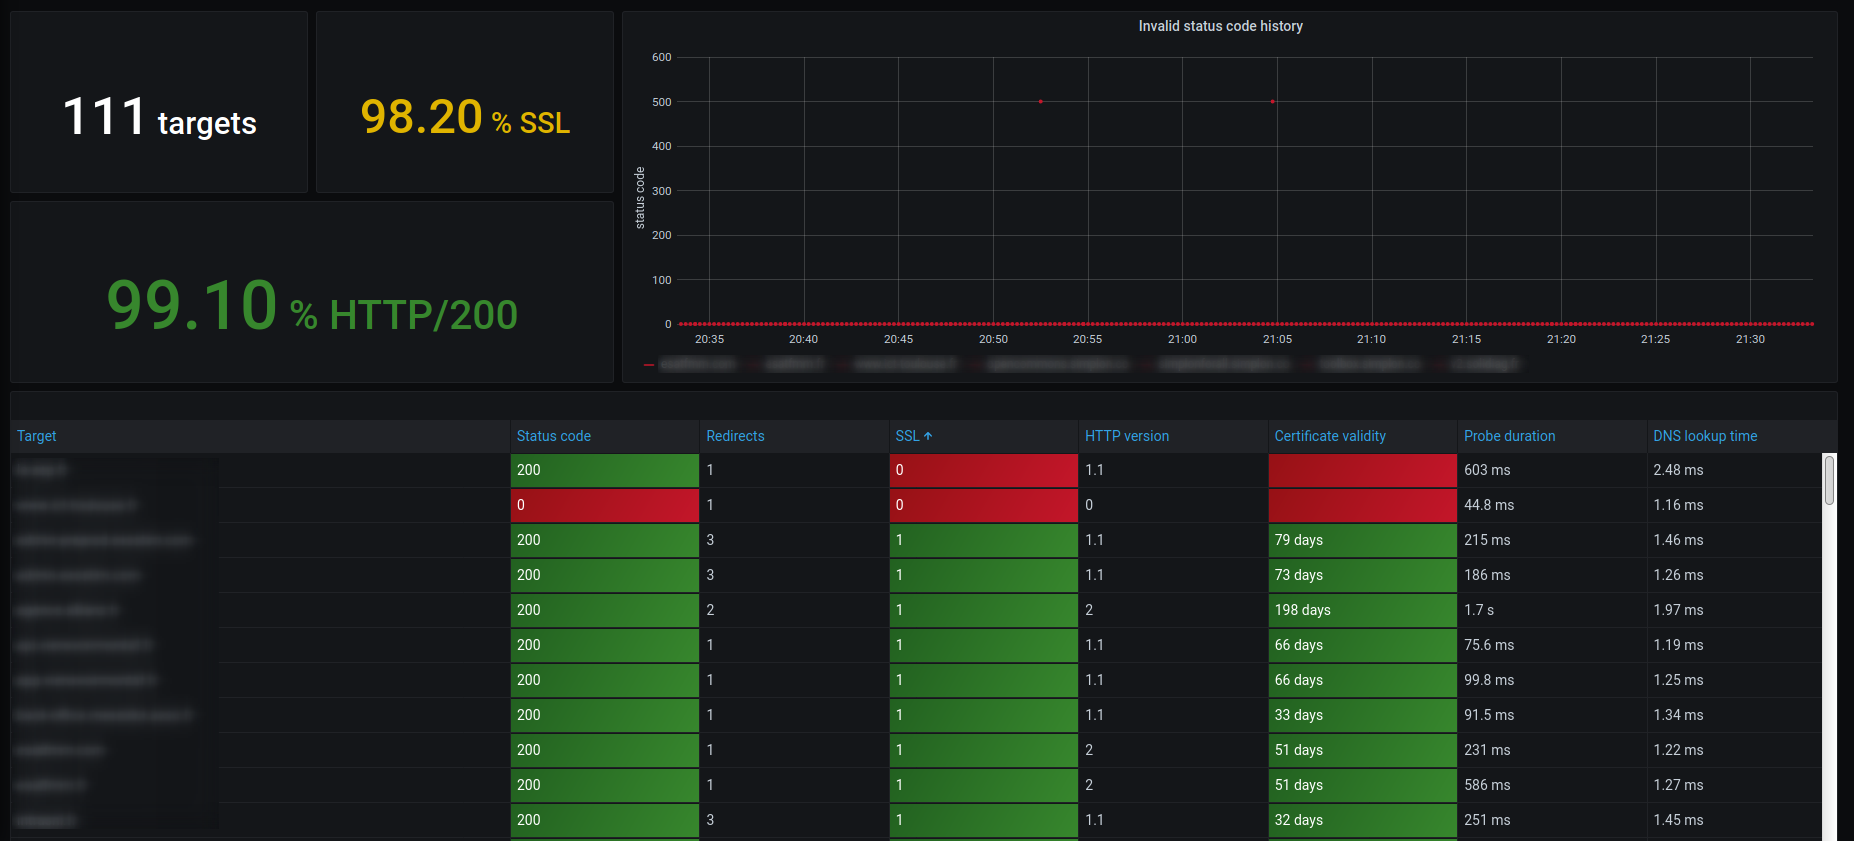
- Total number of targets
- Percentage of HTTP 200 status code
- Percentage of targets using SSL
- Global invalid status code history
Some useful PromQL queries
- Number of days till certificate expiration
(probe_ssl_earliest_cert_expiry{instance=~"$target",job="$http_job"} - time()) / (60*60*24)
- Display bad HTTP status code
probe_http_status_code{job="$http_job",instance=~"$target"} != 200
- Count the number of each status code
count_values("code", probe_http_status_code)
- Percentage of HTTP 200
((count(count by (instance) (probe_http_status_code == 200))) / (count(count by (instance) (probe_http_status_code)))) * 100
- Request blackbox exporter
curl -s "localhost:9115/probe?module=http_2xx&target=target.tld"


