The Florida Department of Health (FDOH) provides COVID-19 deaths by day data
in the Florida_COVID_19_Deaths_by_Day table. Unlike the state's
COVID-19 dashboard, which reports deaths by date of report, deaths
by day represent the number of deaths by exact date of death, based on death
certificate information.
Deaths by day is more useful than deaths by date reported, however the former is very incomplete due to inherent bureaucratic delays in processing deaths certificates. For example the last 10 days always show a "permanent dip," which is very often misinterpreted as decreasing deaths.
This repository provides daily archives of deaths by day data, and scripts to analyze the completeness and reporting delays of this data.
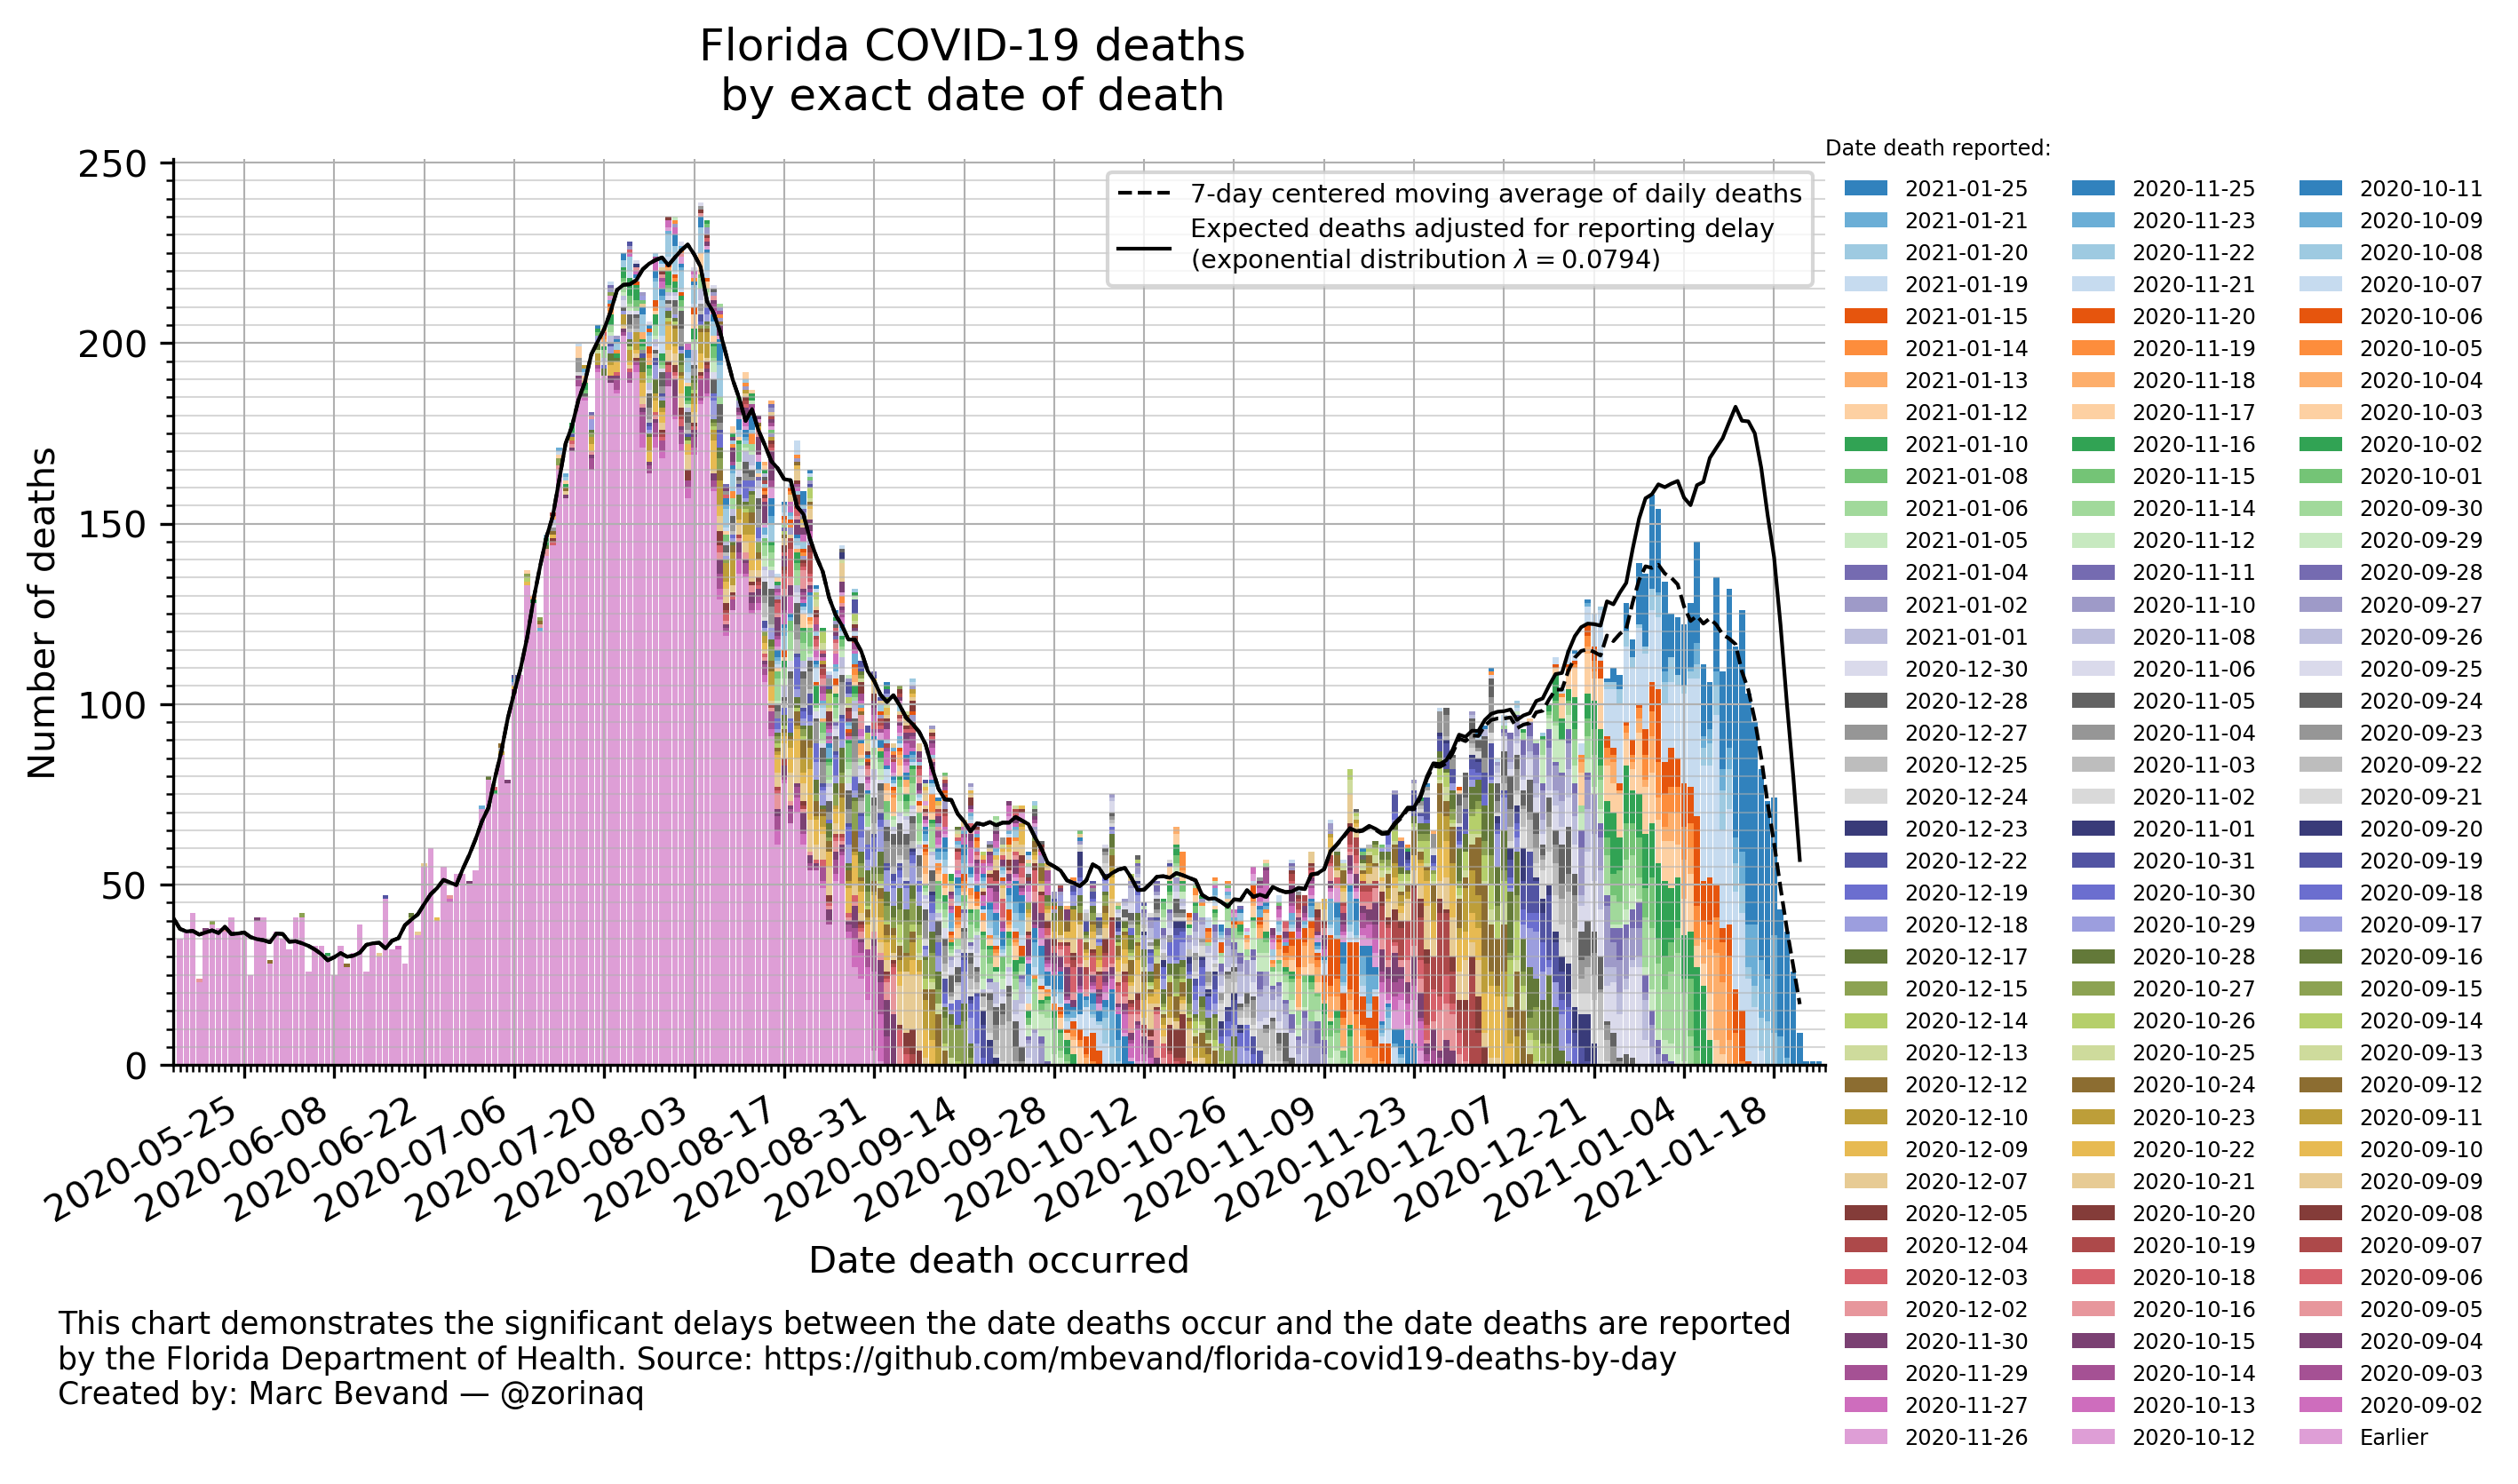
This shows deaths by day, created by the script chart_bars. The colors emphasize the significant delays in death reporting. Each day the state reports more deaths, a new "layer" of colors is added to the bars, with most deaths having occurred in recent days, and some deaths having occurred weeks earlier.
The dashed line represent the moving average of deaths by day, while the solid line is deaths by day adjusted for reporting delays. The adjustment is performed in two steps:
- The average reporting delay is calculated by fitting an exponential distribution, see Average reporting delay; this gives us a CDF (cumulative distribution function)
- Deaths by day are multiplied by the inverse of the CDF. For example if at 4 days after the date of death the CDF is 0.5 (meaning we expect 50% of deaths to be reported,) we multiply deaths by 1 / 0.5 = 2
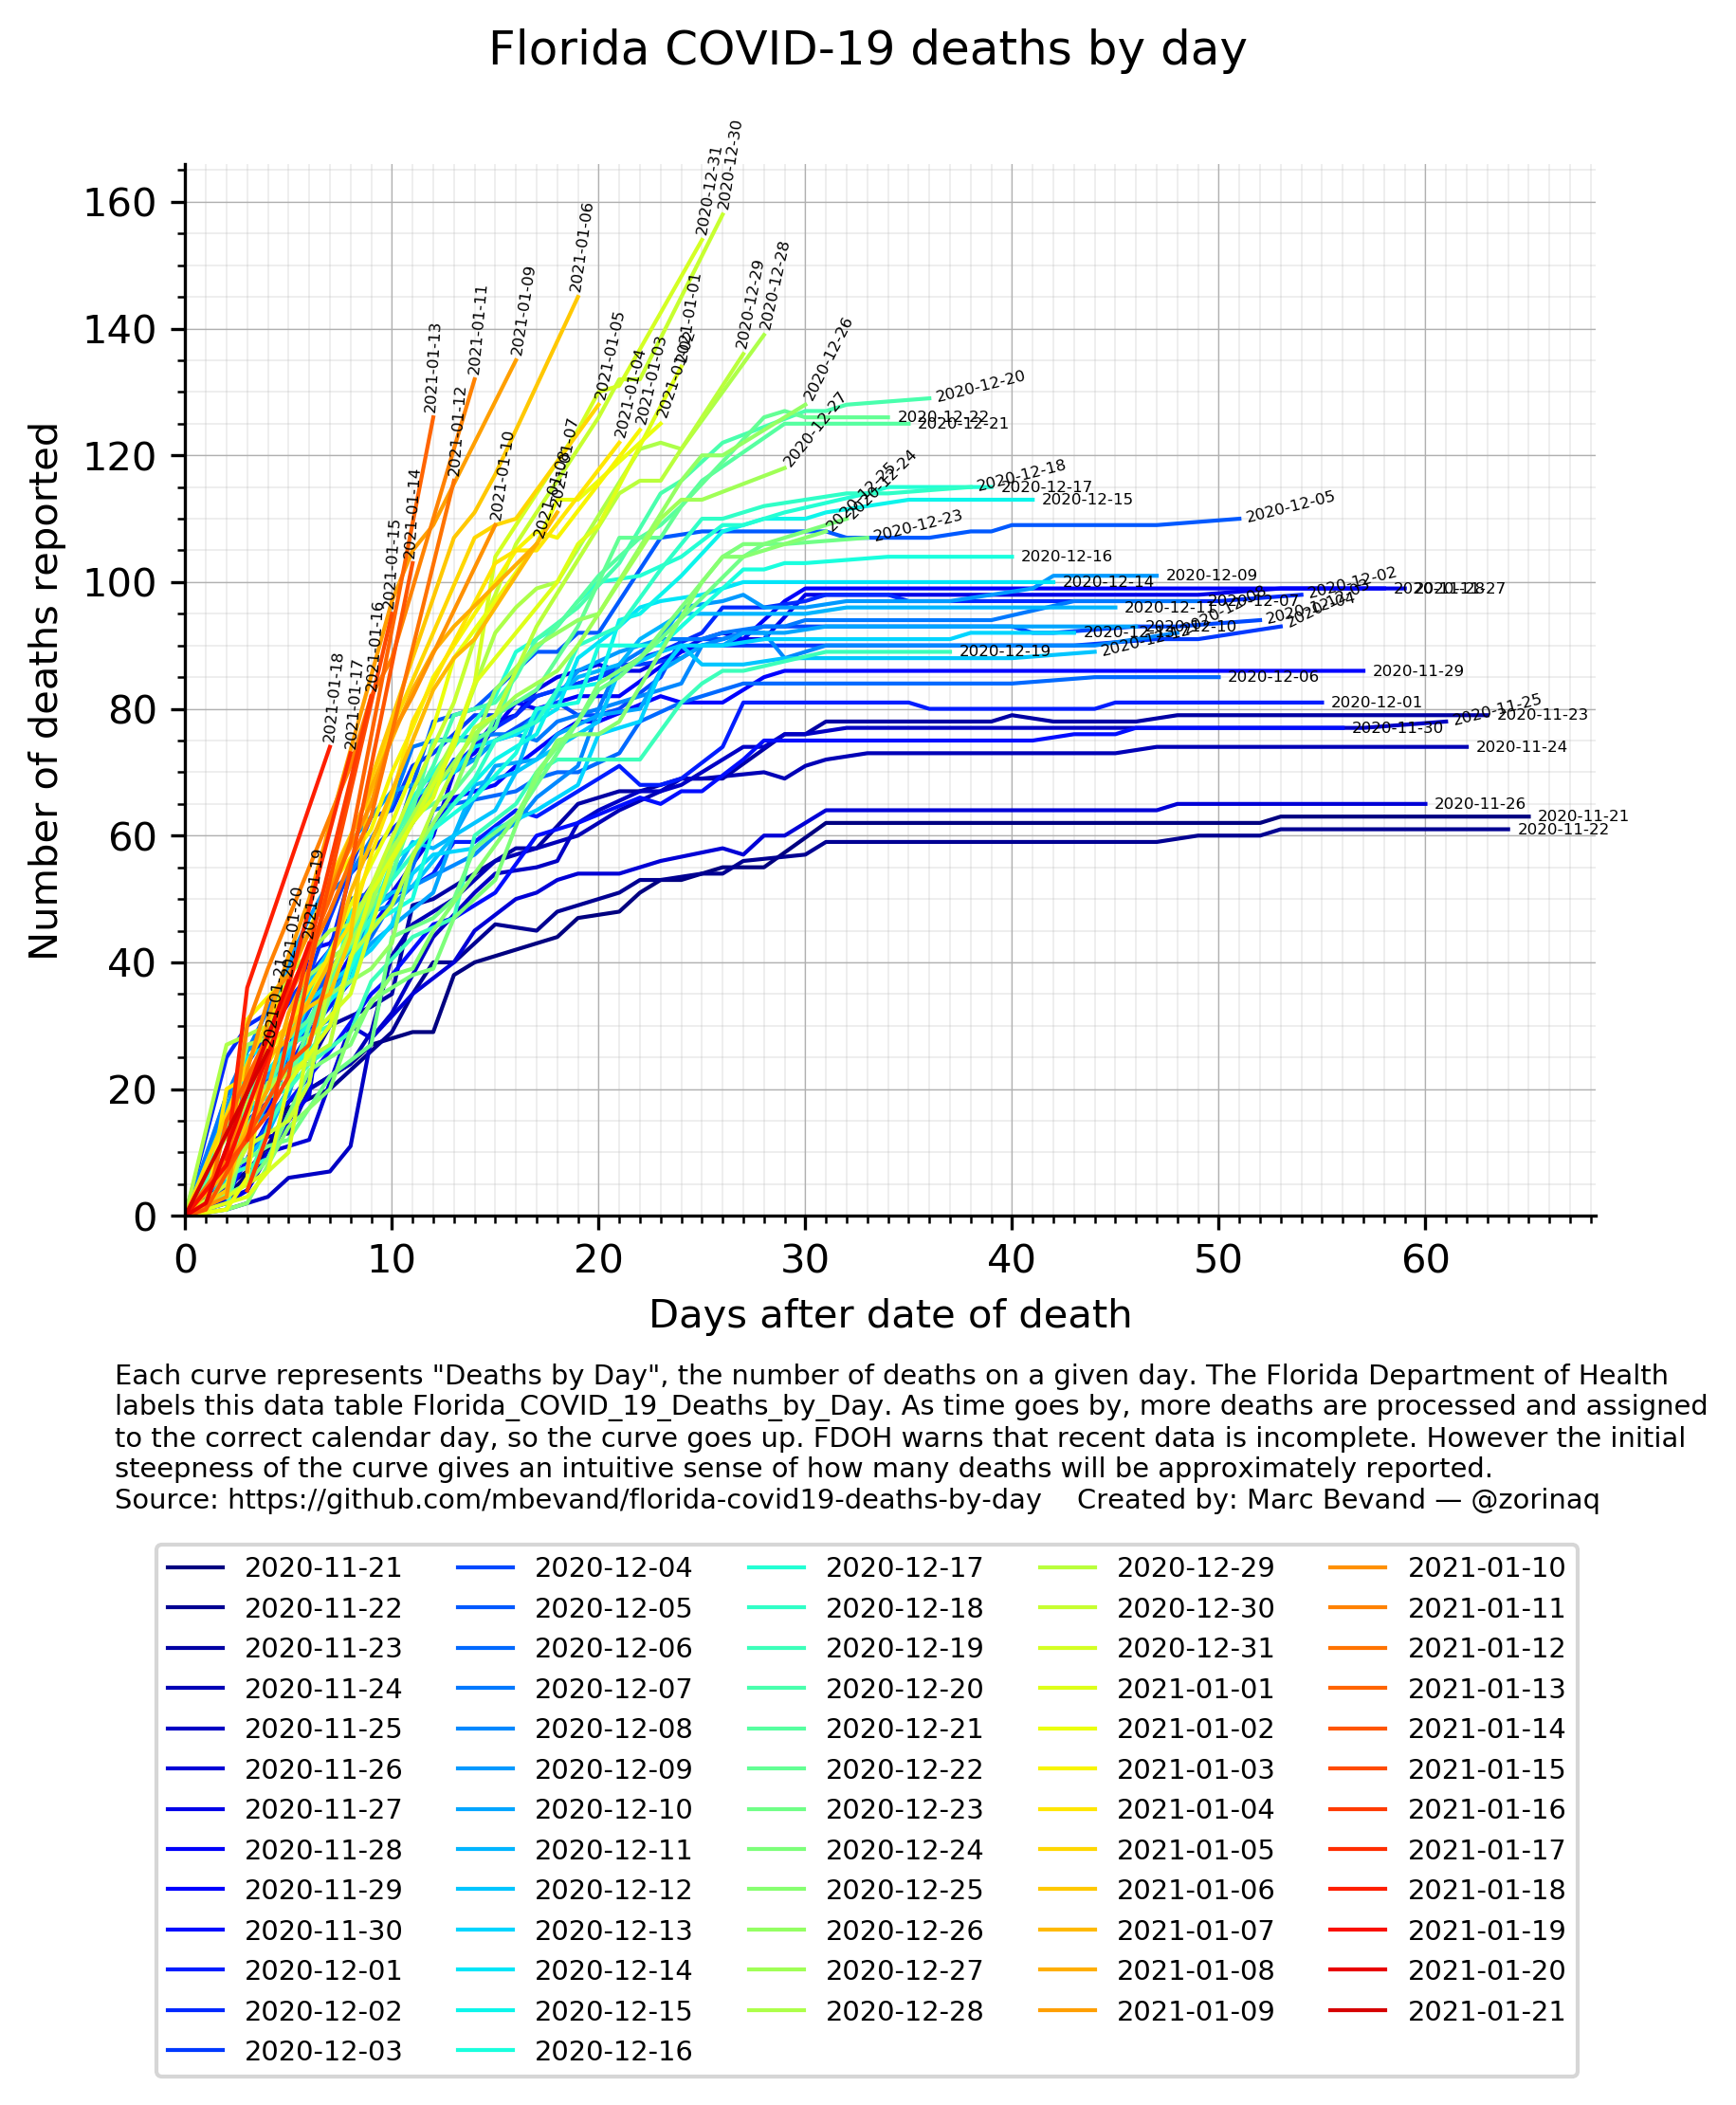
Each curve on the above chart, created by the script chart_rainbow, shows the number of deaths that occurred on a given day. As time goes by, more death certificates are processed and more deaths are assigned to the correct calendar day, so the curve goes up. The initial steepness of the curve gives an intuitive sense of how many deaths will be approximately reported, despite the data being incomplete. The leftmost curves are expected to establish new record-high numbers of deaths.
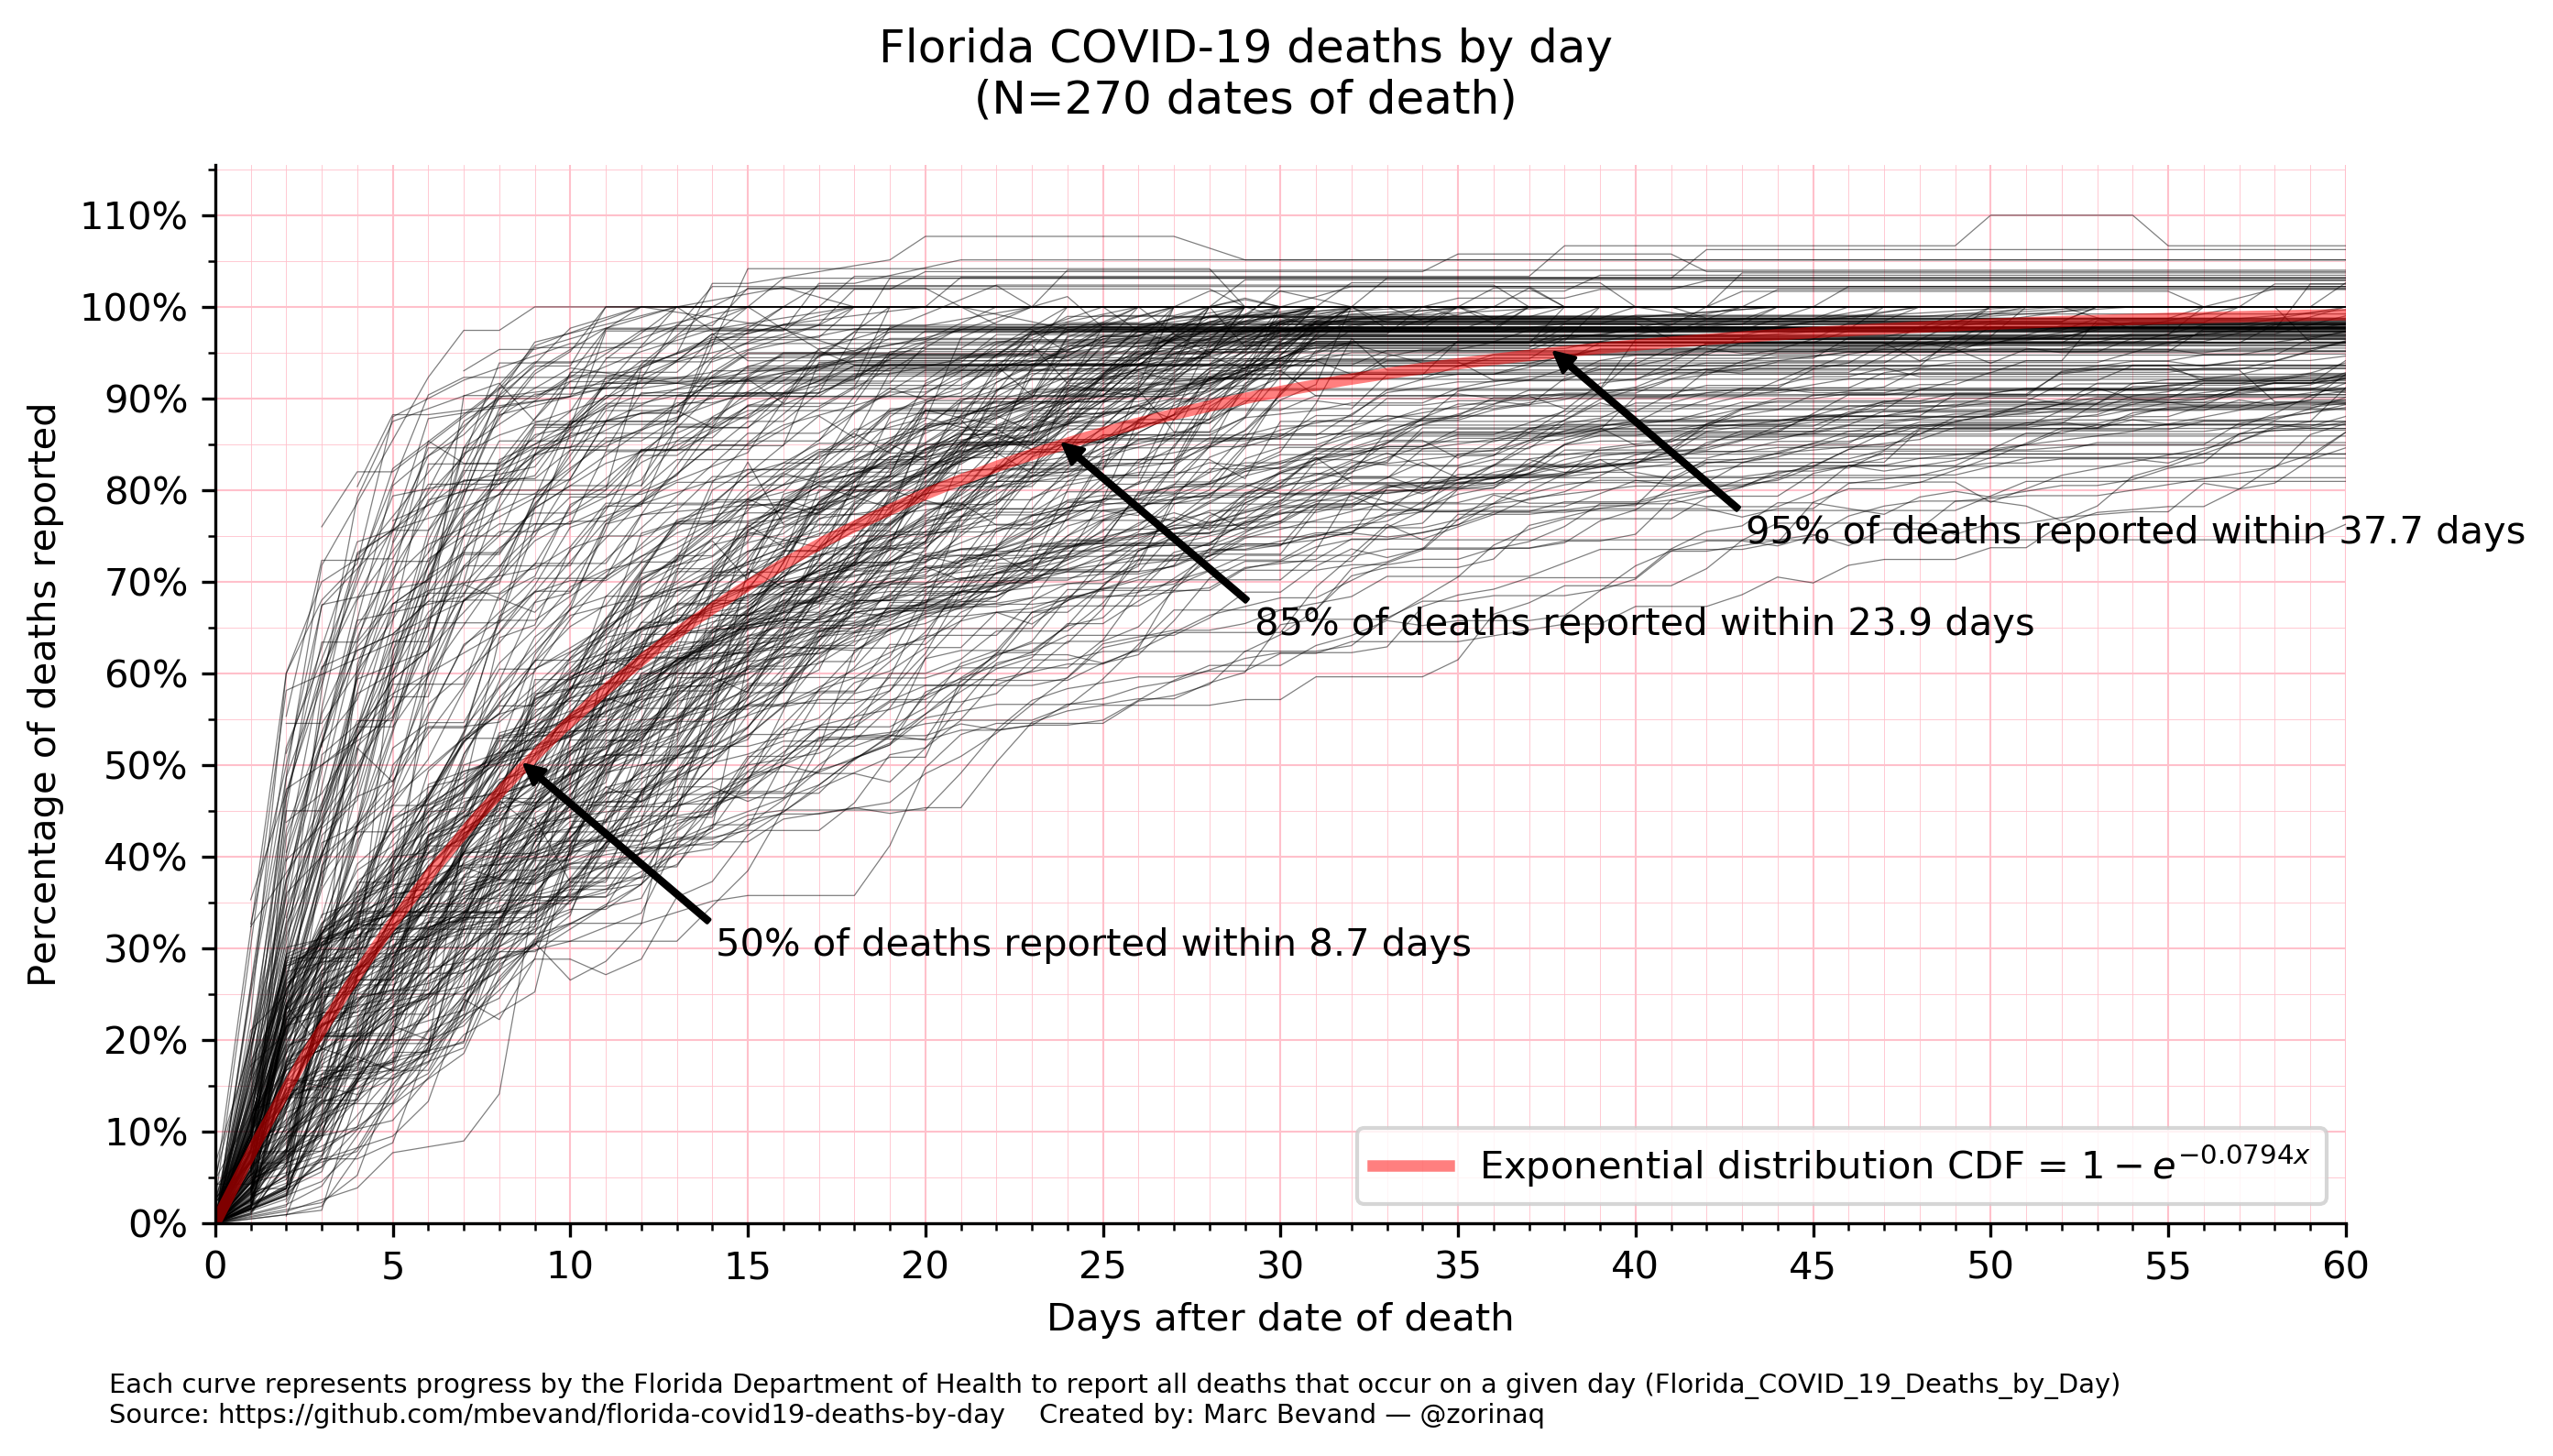
This chart, created by the script chart_average_reporting_delay, shows the average reporting delay, and fits an exponential distribution. We see that, on average:
- 50% of deaths are reported within 5 days
- 85% of deaths are reported within 13 days
- 95% of deaths are reported within 21 days
The exponential distribution CDF gives the proportion of deaths that are expected to have been reported within x days:
1 - e-λx
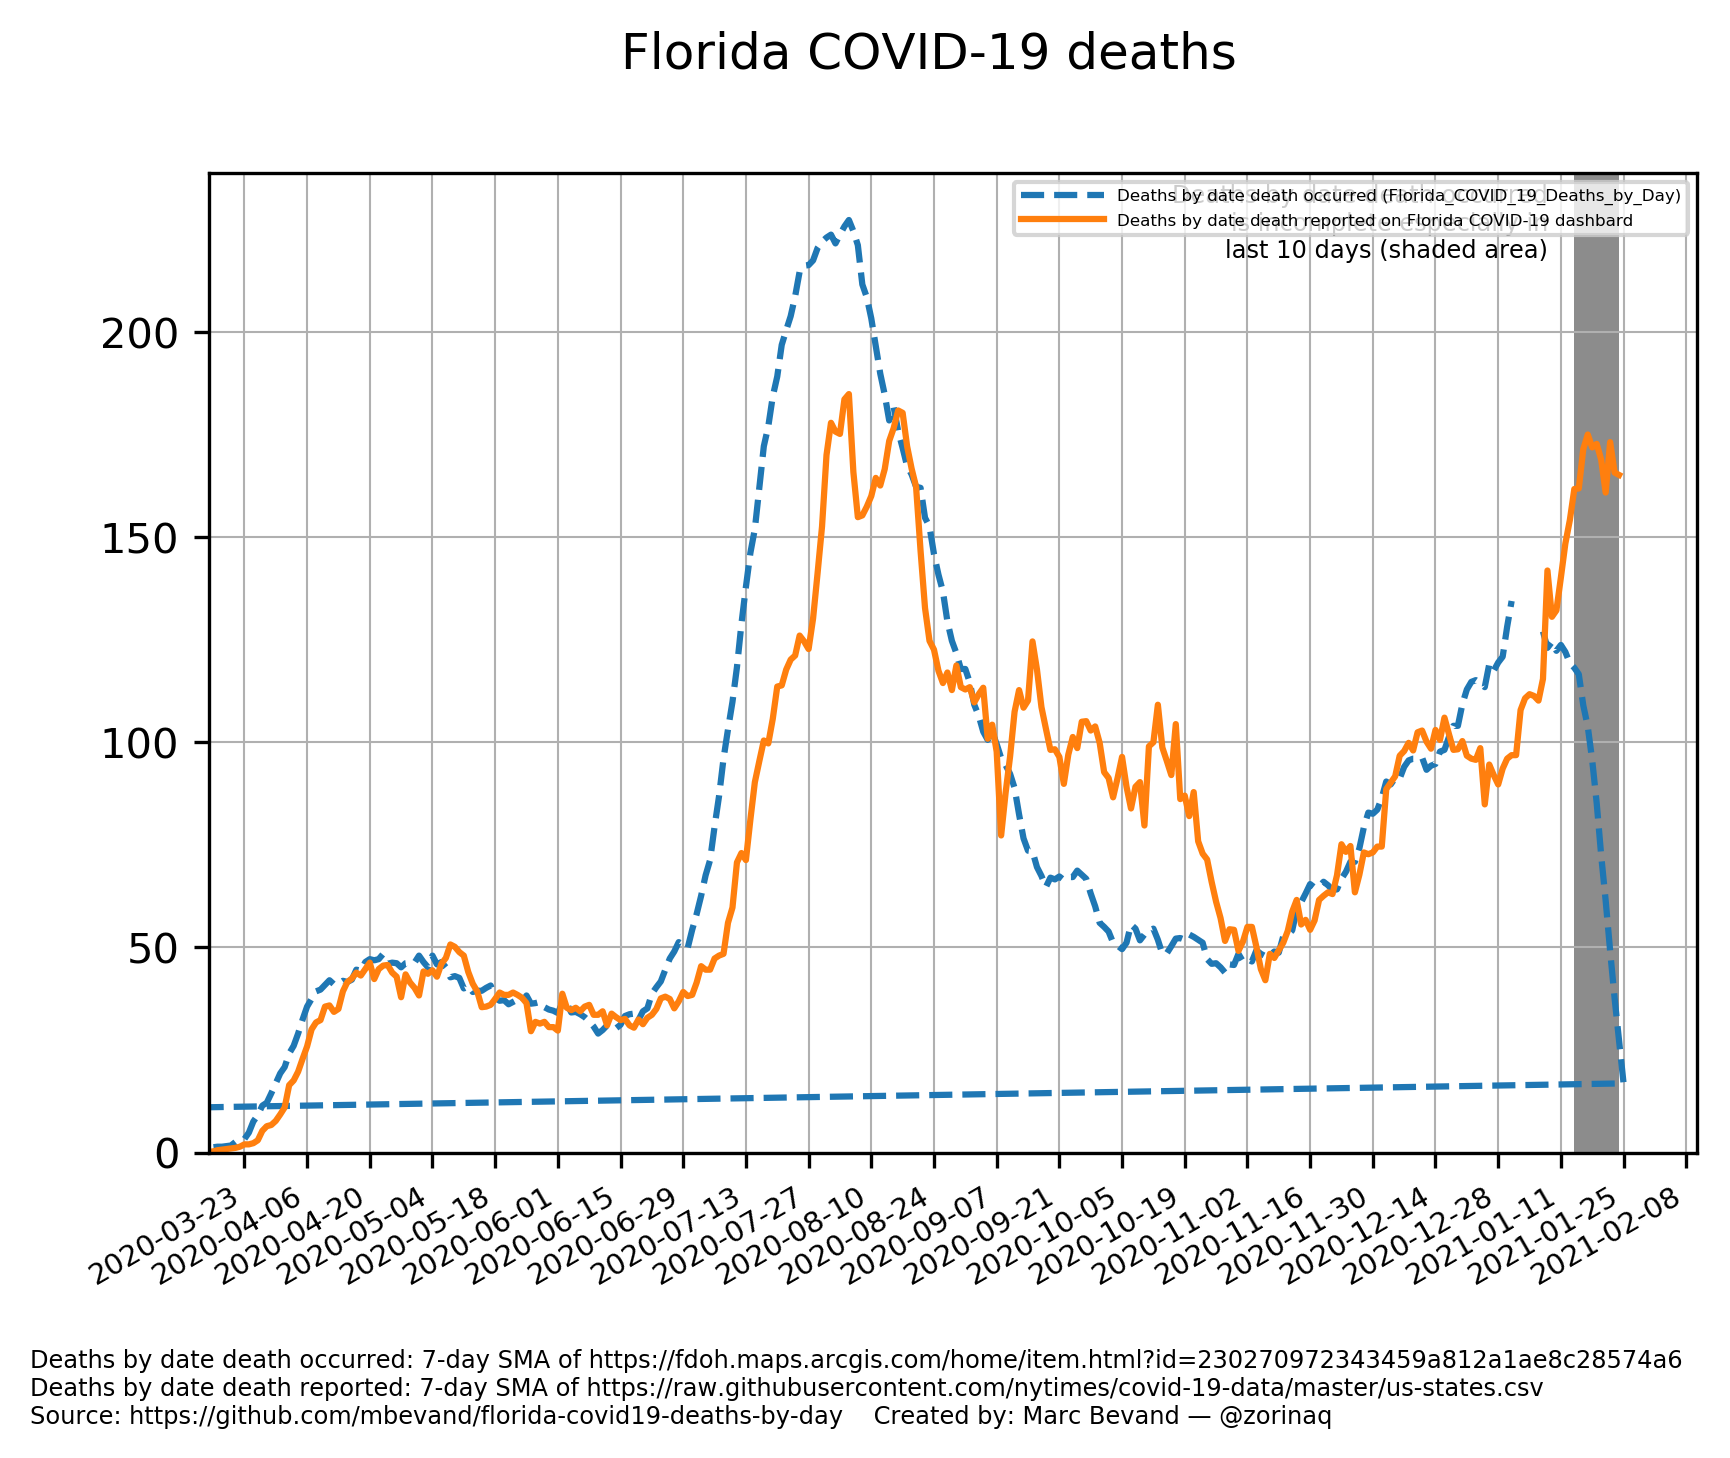
This chart, created by the script chart_deaths_occurred_vs_reported, shows the reporting lag. Deaths by date of death are always higher than deaths by date of report in periods of increasing deaths (because of the lag.)
The CSV files in this repository are daily archives of the
Florida_COVID_19_Deaths_by_Day table. FDOH appears to update the table
once a day around 10am-11am Eastern time.
The download Python script automatically downloads the table, converts it from
JSON to CSV format, and saves it as deathsbydateexport_YYYYMMDD.csv. The columns are:
Date: milliseconds since UNIX Epoch timeDeaths: number of deaths on this dateObjectId: unknown—not important
If for whatever reason you want to download the table without using the script:
- Browse
Florida_COVID_19_Deaths_by_Day - Click on View
- Click on table Florida_COVID_19_Deaths_by_Day
- Click on Query
- Type:
Where: ObjectId>0 Result type: standard Out Fields: * Format: JSON - Click Query (GET)
- The above URL returns the data in JSON format
I would like to encourage you to visit FLDoH Data Sharing Links, a community effort archiving other datasets from FDOH.


