Lightning detector the utilises SMDKINGS EMP detector(https://www.smdking.com/) coupled with an Arduino nano
Code has been tested on Arduino nano, compiled using Arduino IDE 1.8.9 & 1.8.13.
Before this will compile in Arduino IDE you will need to make sure you have installed the following libraries into Arduino IDE:- -Adafruit SSD1306 1.1.2 -Adafruit GFX 1.2.3
Find this from Tools->Manage Libraries menu item in the Arduino IDE.
Next you will to modify one of the header files in the Adafruit SSD1306 library to make sure the OLED display is compiled with the correct display size setting.
The file you need to find is called Adafruit_SSD1306.h. The libraries are located in the main install folder of Arduino IDE\libraries\ or your Arduino project workarea\libraries - see (https://www.arduino.cc/en/guide/libraries) for further help where these libraries are located. You can always search your computer for Adafruit_SSD1306.h to try and brute force it's location.
Once found you need to locate the following lines in the file
#define SSD1306_128_64 // #define SSD1306_128_32 // #define SSD1306_96_16
Ensure the entry #define SSD1306_128_64 is the line that is uncommented.
Failure to set this correctly will cause the text to look streatched on the screen.
After these modifications the code is ready to compile.
Once the skecth has been loaded to your arduino it will start to sequence through a set of screens displaying various bits of information. The following describes each screen. The period can be controlled by adjusting the switch_screen_time variable in the code. set to 5000ms(5seconds) by default.
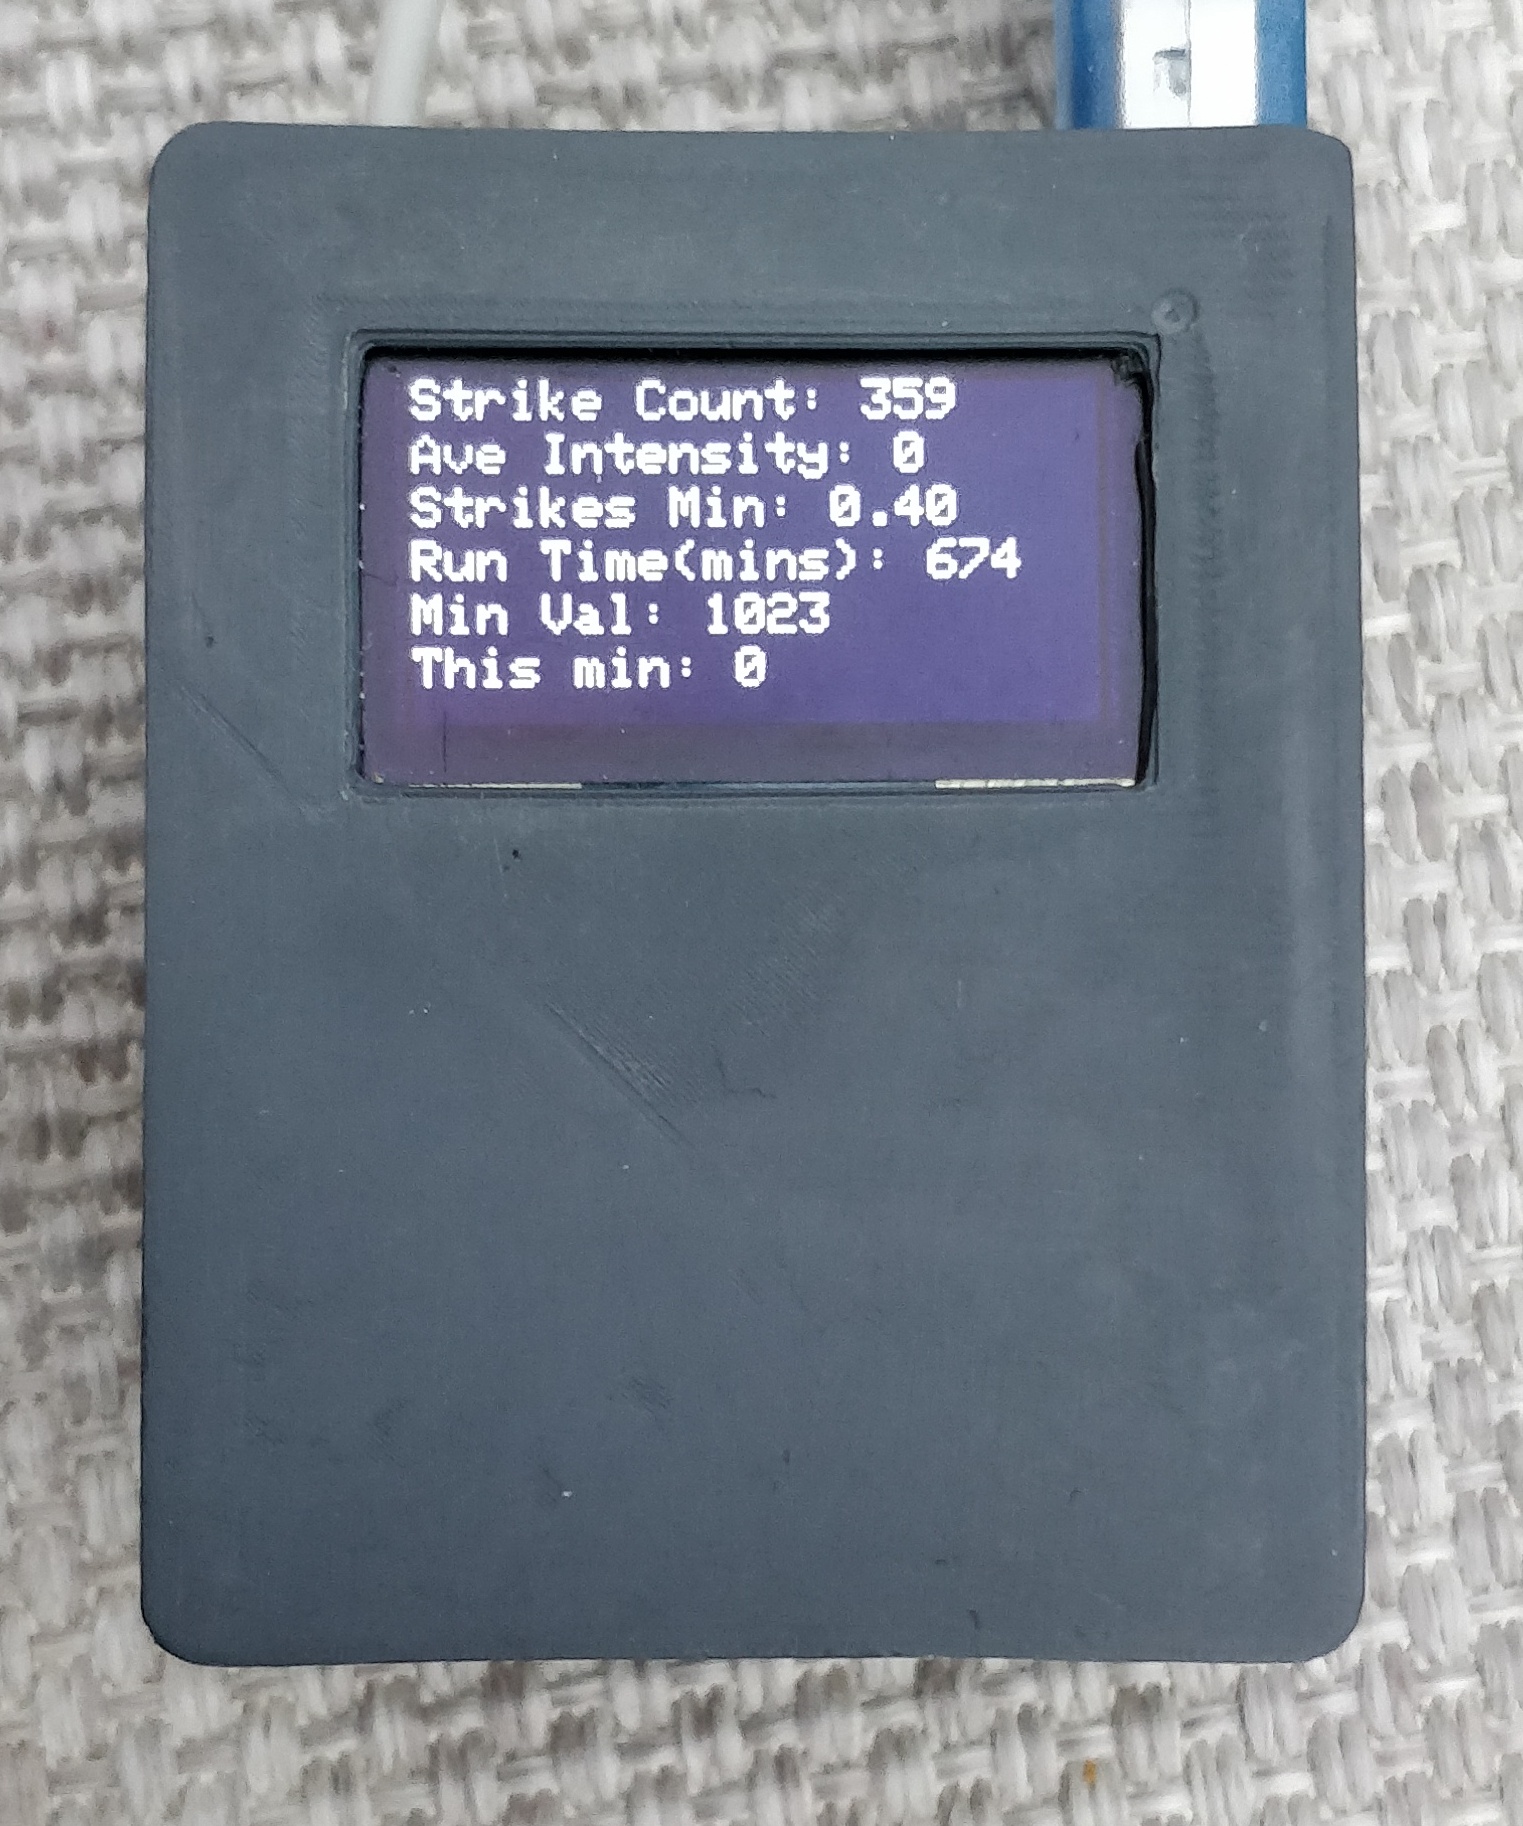
Displays information in text format about detected lightning strikes
- Strike Count: - Total number of strikes detected since device has been turned on.
- Ave intensity: - Gives the average sampled value of sig-A.
- Strikes min: - Displays rolling average of strikes over 5 min period
- Run Time: - Number of minutes device has been turned on for.
- Min Val: - Is the lowest value of Sig A (mostly used for experimentation) over a minute.
- This min: - Displays the number of strikes in the current minute.
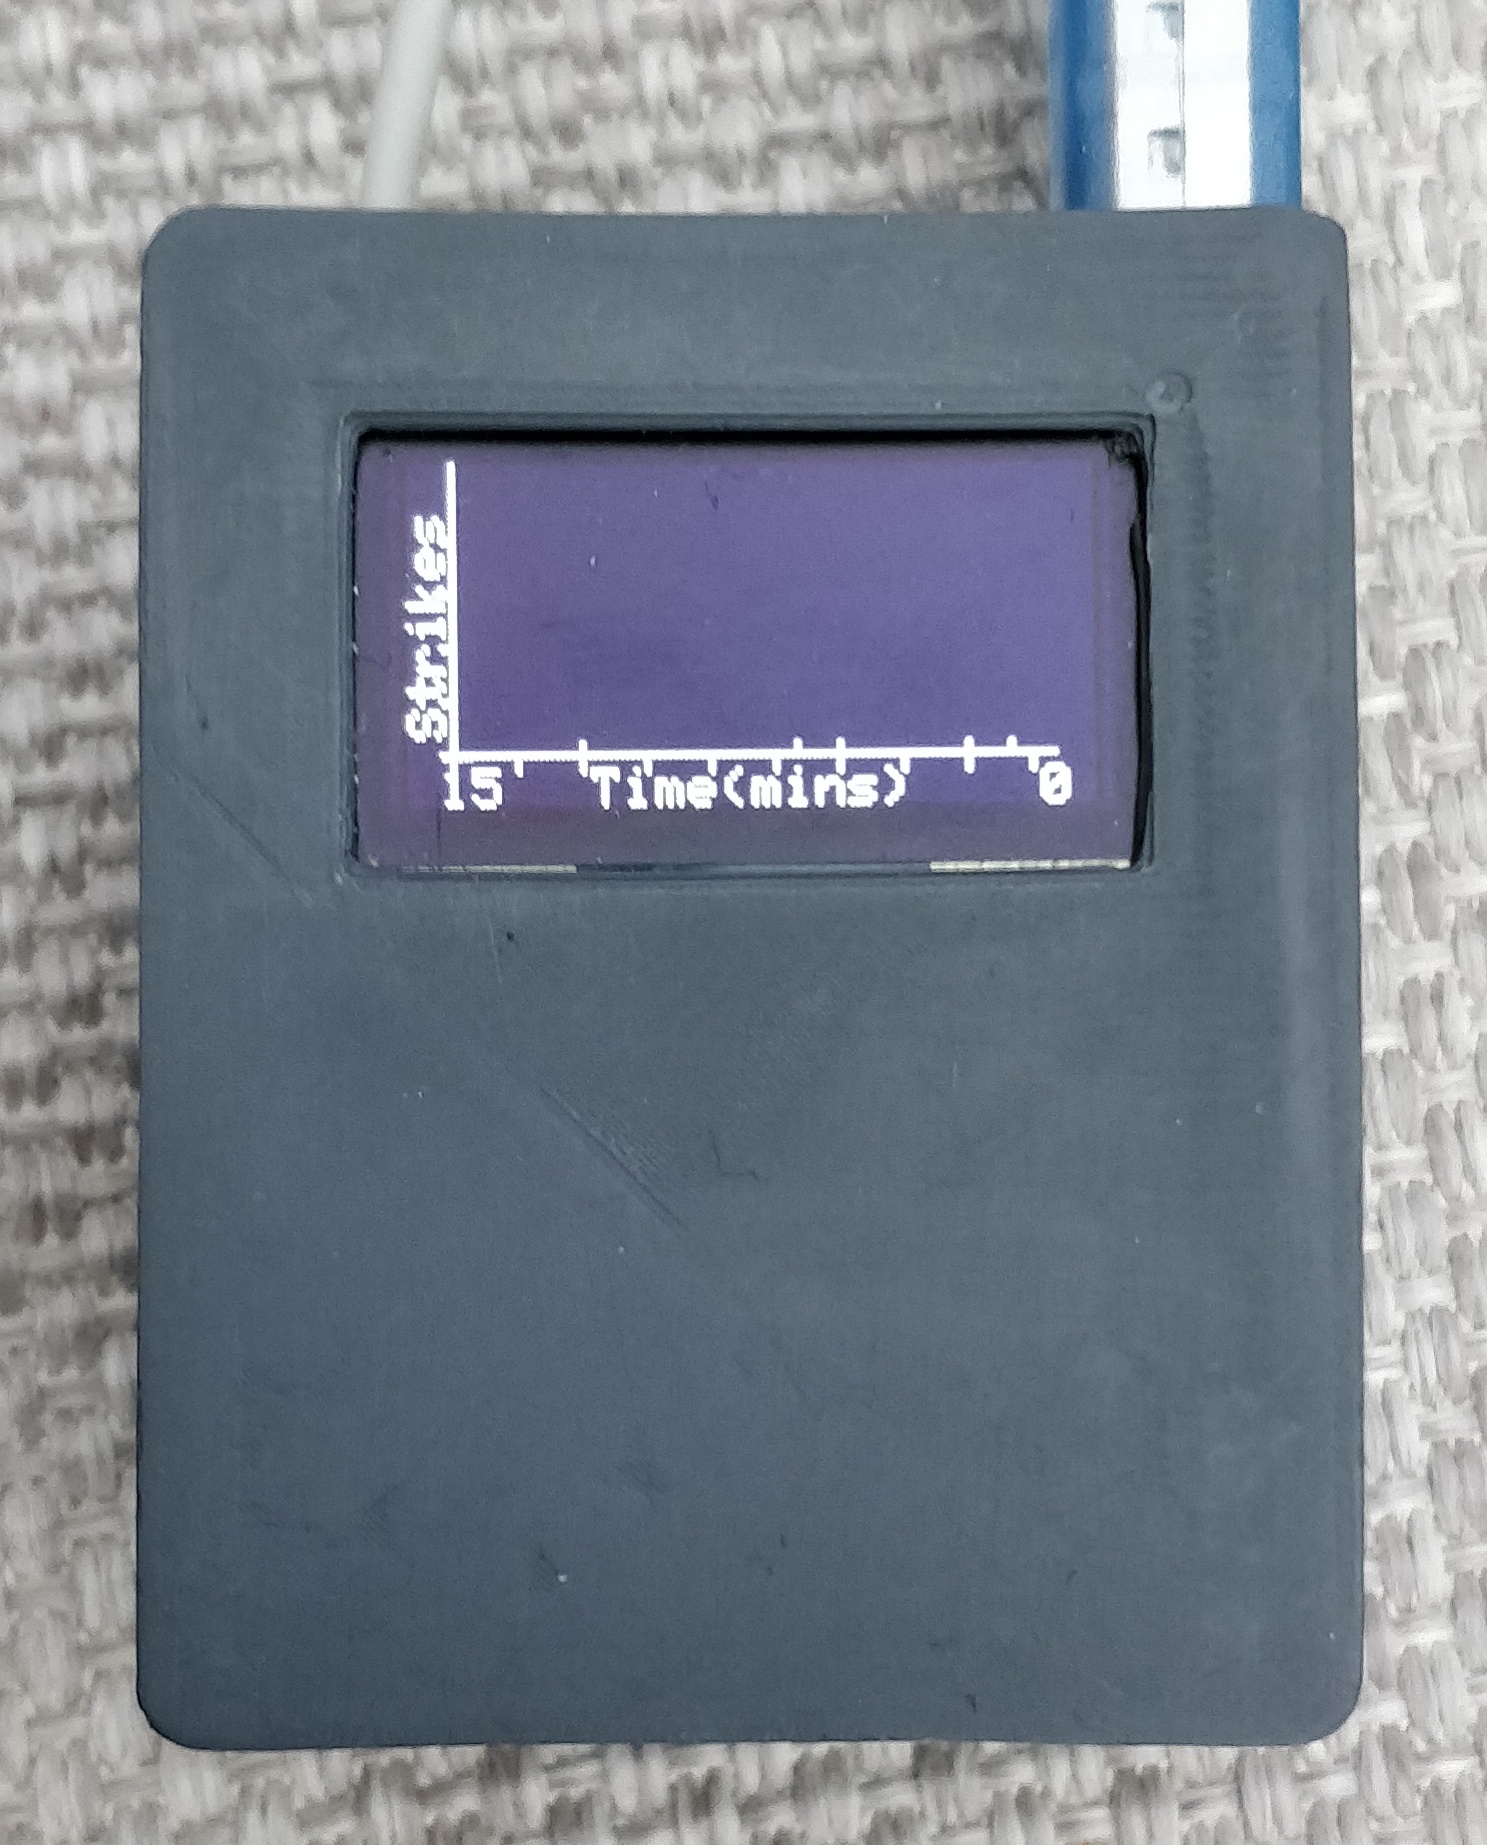
Dsiplays number of detected lightning strikes per minute over a period of 15 minutes. This chart provides useful trend information on frequency of detected lightning strikes.
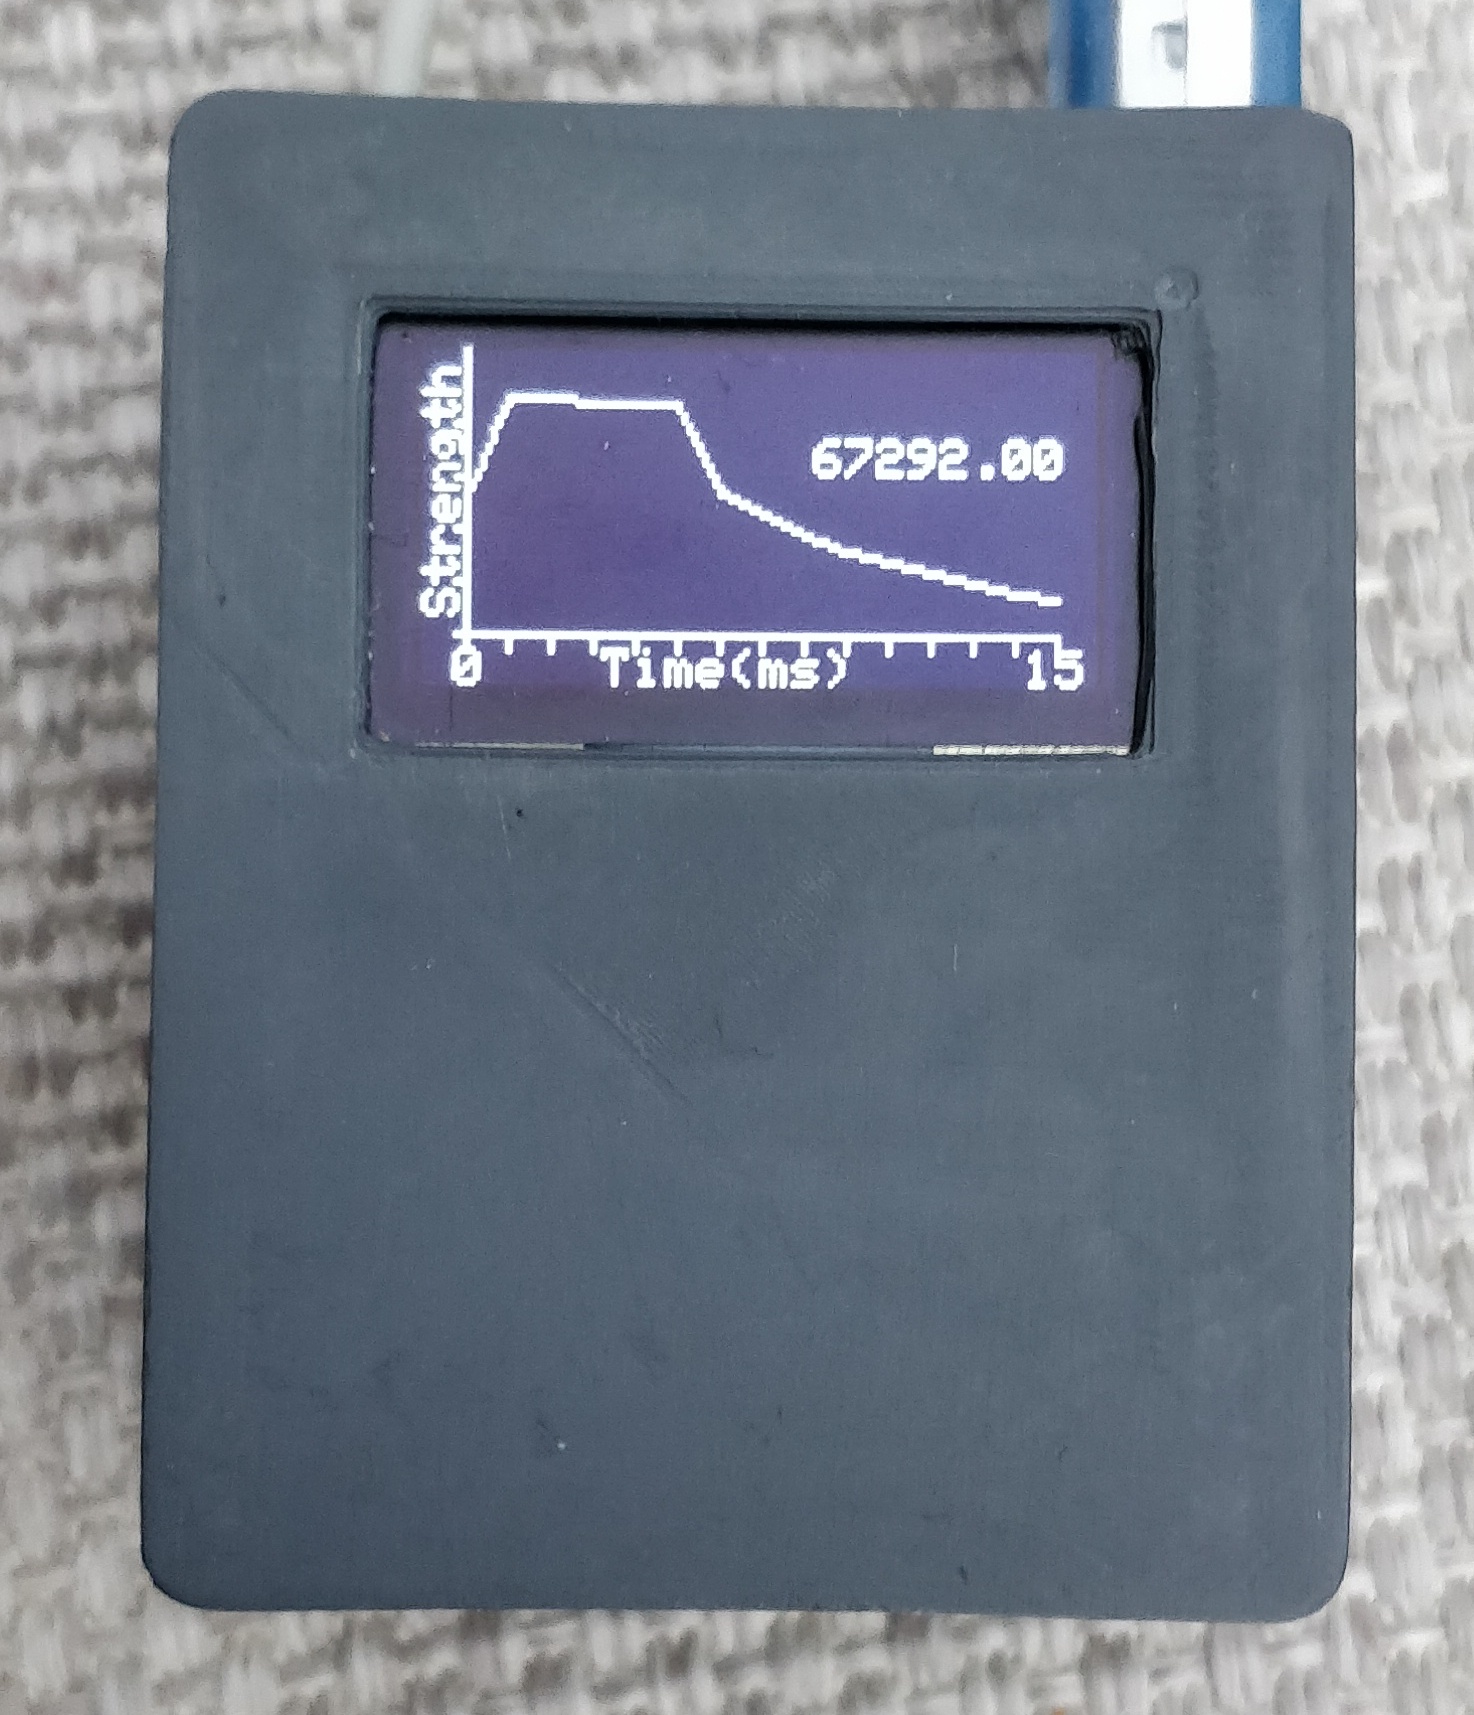
Shows sampled data from sig-A pin just after sig-D is triggered
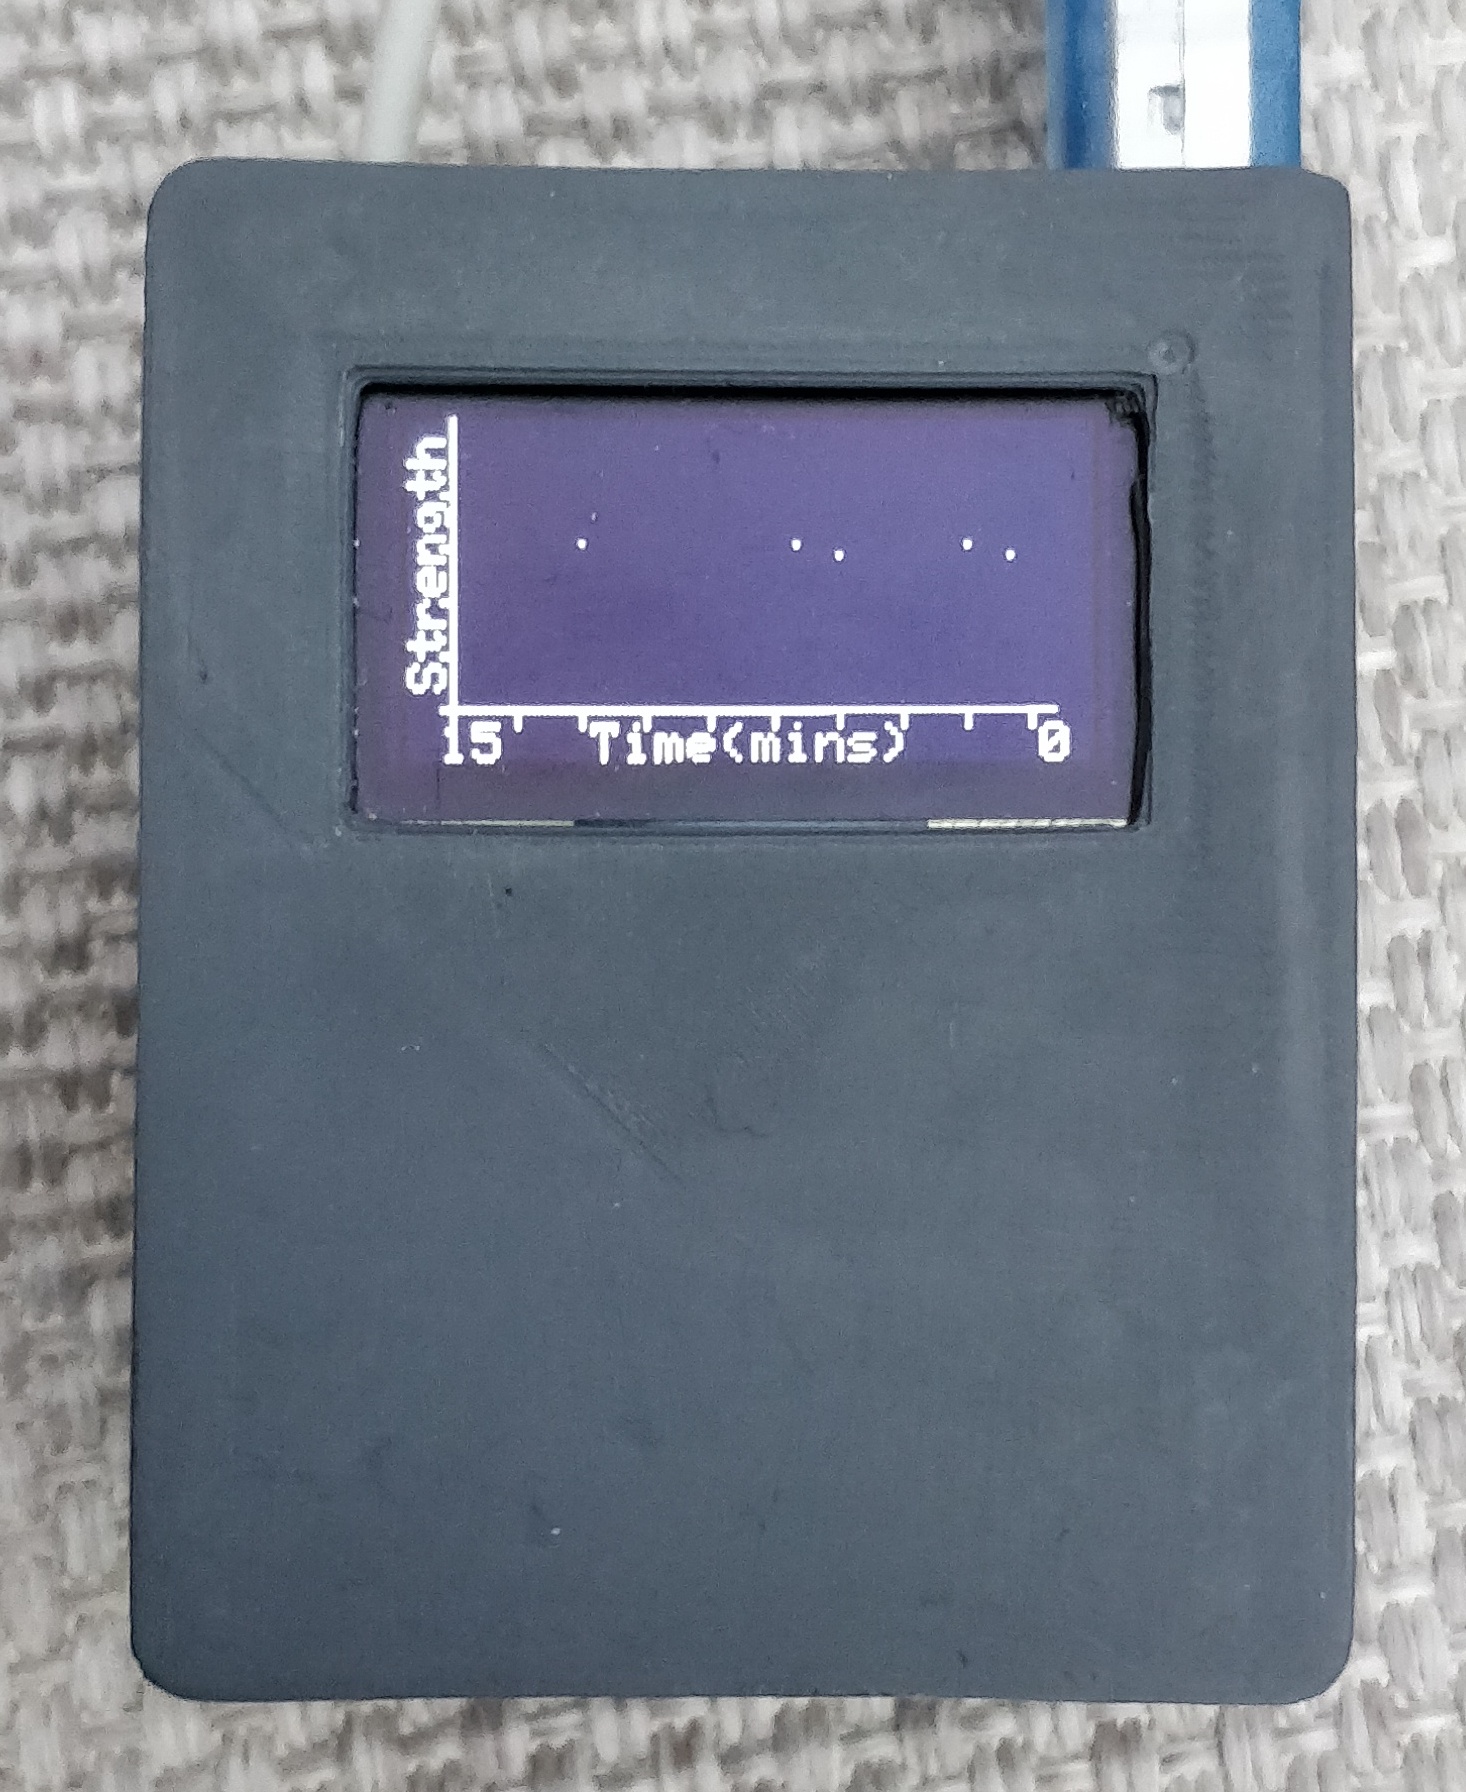
Shows strength of detected lightning strikes over a period of 15 mins. This is based on sig-A data and should be considered experimental.
The Sig-A_Sample folder provides a Arduino sketch to capture the signal generated on sig-A pin of the SMDKING EMP detection module. A number of prescalers are defined that allow sample rate of the ADC converter of the Arduino device to be changed. By defalt the prescale factor is set to 128, with a cpu speed of 16Mhz this gives 16MHz/128 = 125 KHz. It takes 13 clock cycles to convert the analogue signal to digital making the default sample rate = 125Khz/13 = 9600Hz Setting the prescaler to 16 gives 16Mhz/16 = 1Mhz, 1Mhz/13 = 77Khz sample rate. This does come at a cost of precision, best thing to do is try the different prescalers and compare your results.
Running at 77Khz sample rate I was able to obtain data that plotted the following chart.


