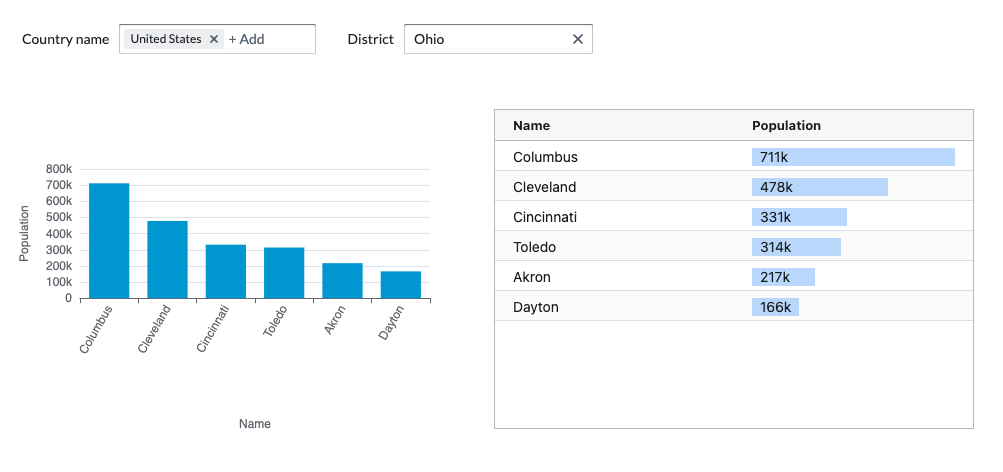
A series of prebuilt React components for visualizing data from cube APIs.
These components are driven by metadata and knowledge of the cube schema in order to minimize configuration required and work out-of-the-box despite some sacrifice of flexibility because sometimes you want more control than a BI tool, but you still want to control the code around it.
Add the @cubeviz/core dependency and any of the other @cubeviz packages
you need
npm install --save @cubeviz/core @cubeviz/echartsIn orer to use these components, you first must set up the context. For example:
import { CubeVizContextProvider } from '@cubeviz/core';

<CubeVizContextProvider
     // your @cubejs-client/core CubeApi object
    cubejsApi={cubeApi}
    // what to render if there is an error loading your metadata
    renderError={(error) => (
      <NonIdealState
        icon="error"
        title={error.name}
        description={error.message}
      />
    )}
    // what to render when loading your cube api
    loadingDisplay={
      <NonIdealState icon={<Spinner />} title="Loading cubes..." />
    }
  >
  ...the rest of your app
</CubeVizContextProvider>Now, in your app you can use the cube components you wish. The components take your cube measures or dimensions as inputs for the rendering fields and will fetch the data and try to pick reasonable defaults for formatting.
<EChartsXYChart
  x="Cities.name"
  y="Cities.population"
  chartType="bar"
/>
Every component accepts a baseQuery prop which allows you specify the base cube query that the component will build from. This is helpful when you want to preset a filter on the results. This baseQuery can be dynamic for instance
we can combine the component above with a country selector like so:
const [selectedCountry, setSelectedCountry] = useState(undefined as string | undefined);

return <>
  <CubeSelect
    title="Country name"
    labelBinding="Countries.name"
    valueBinding="Countries.totalPopulation"
    selectedItem={selectedCountry}
    setSelectedItem={country => setSelectedCountry(country)}
  />
  <EChartsXYChart
    x="Cities.name"
    y="Cities.population"
    chartType="bar"
    baseQuery={selectedCountry ? {
      filters: [{
        member: 'Countries.name',
        operator: 'equals',
        values: [selectedCountry]
      }]
    } : undefined}
  />
</>
Now the chart will show all city populations by default, but when you select a country, it will drill down into cities in that country.
See the apps/demo-app for more examples of this.
For local development, this library provides a simple cube api you can start up
from the backend/worlddb-cube dir with a docker-compose up.
To start the demo app, you can run just dev or pnpm run dev
This library is still early on in development and welcoming contributions.
Here are some thoughts for the roadmap:
Configuration
- Ability to configure result sorting
- Better auto-formatting
- Formatting configuration driven from cube metadata
- Ability to plot unreleated measures across a shared date axis
- Async search for select inputs
Developer Experience
- Generated type-safe cube fields instead of strings
- CI
New widgets / inputs
