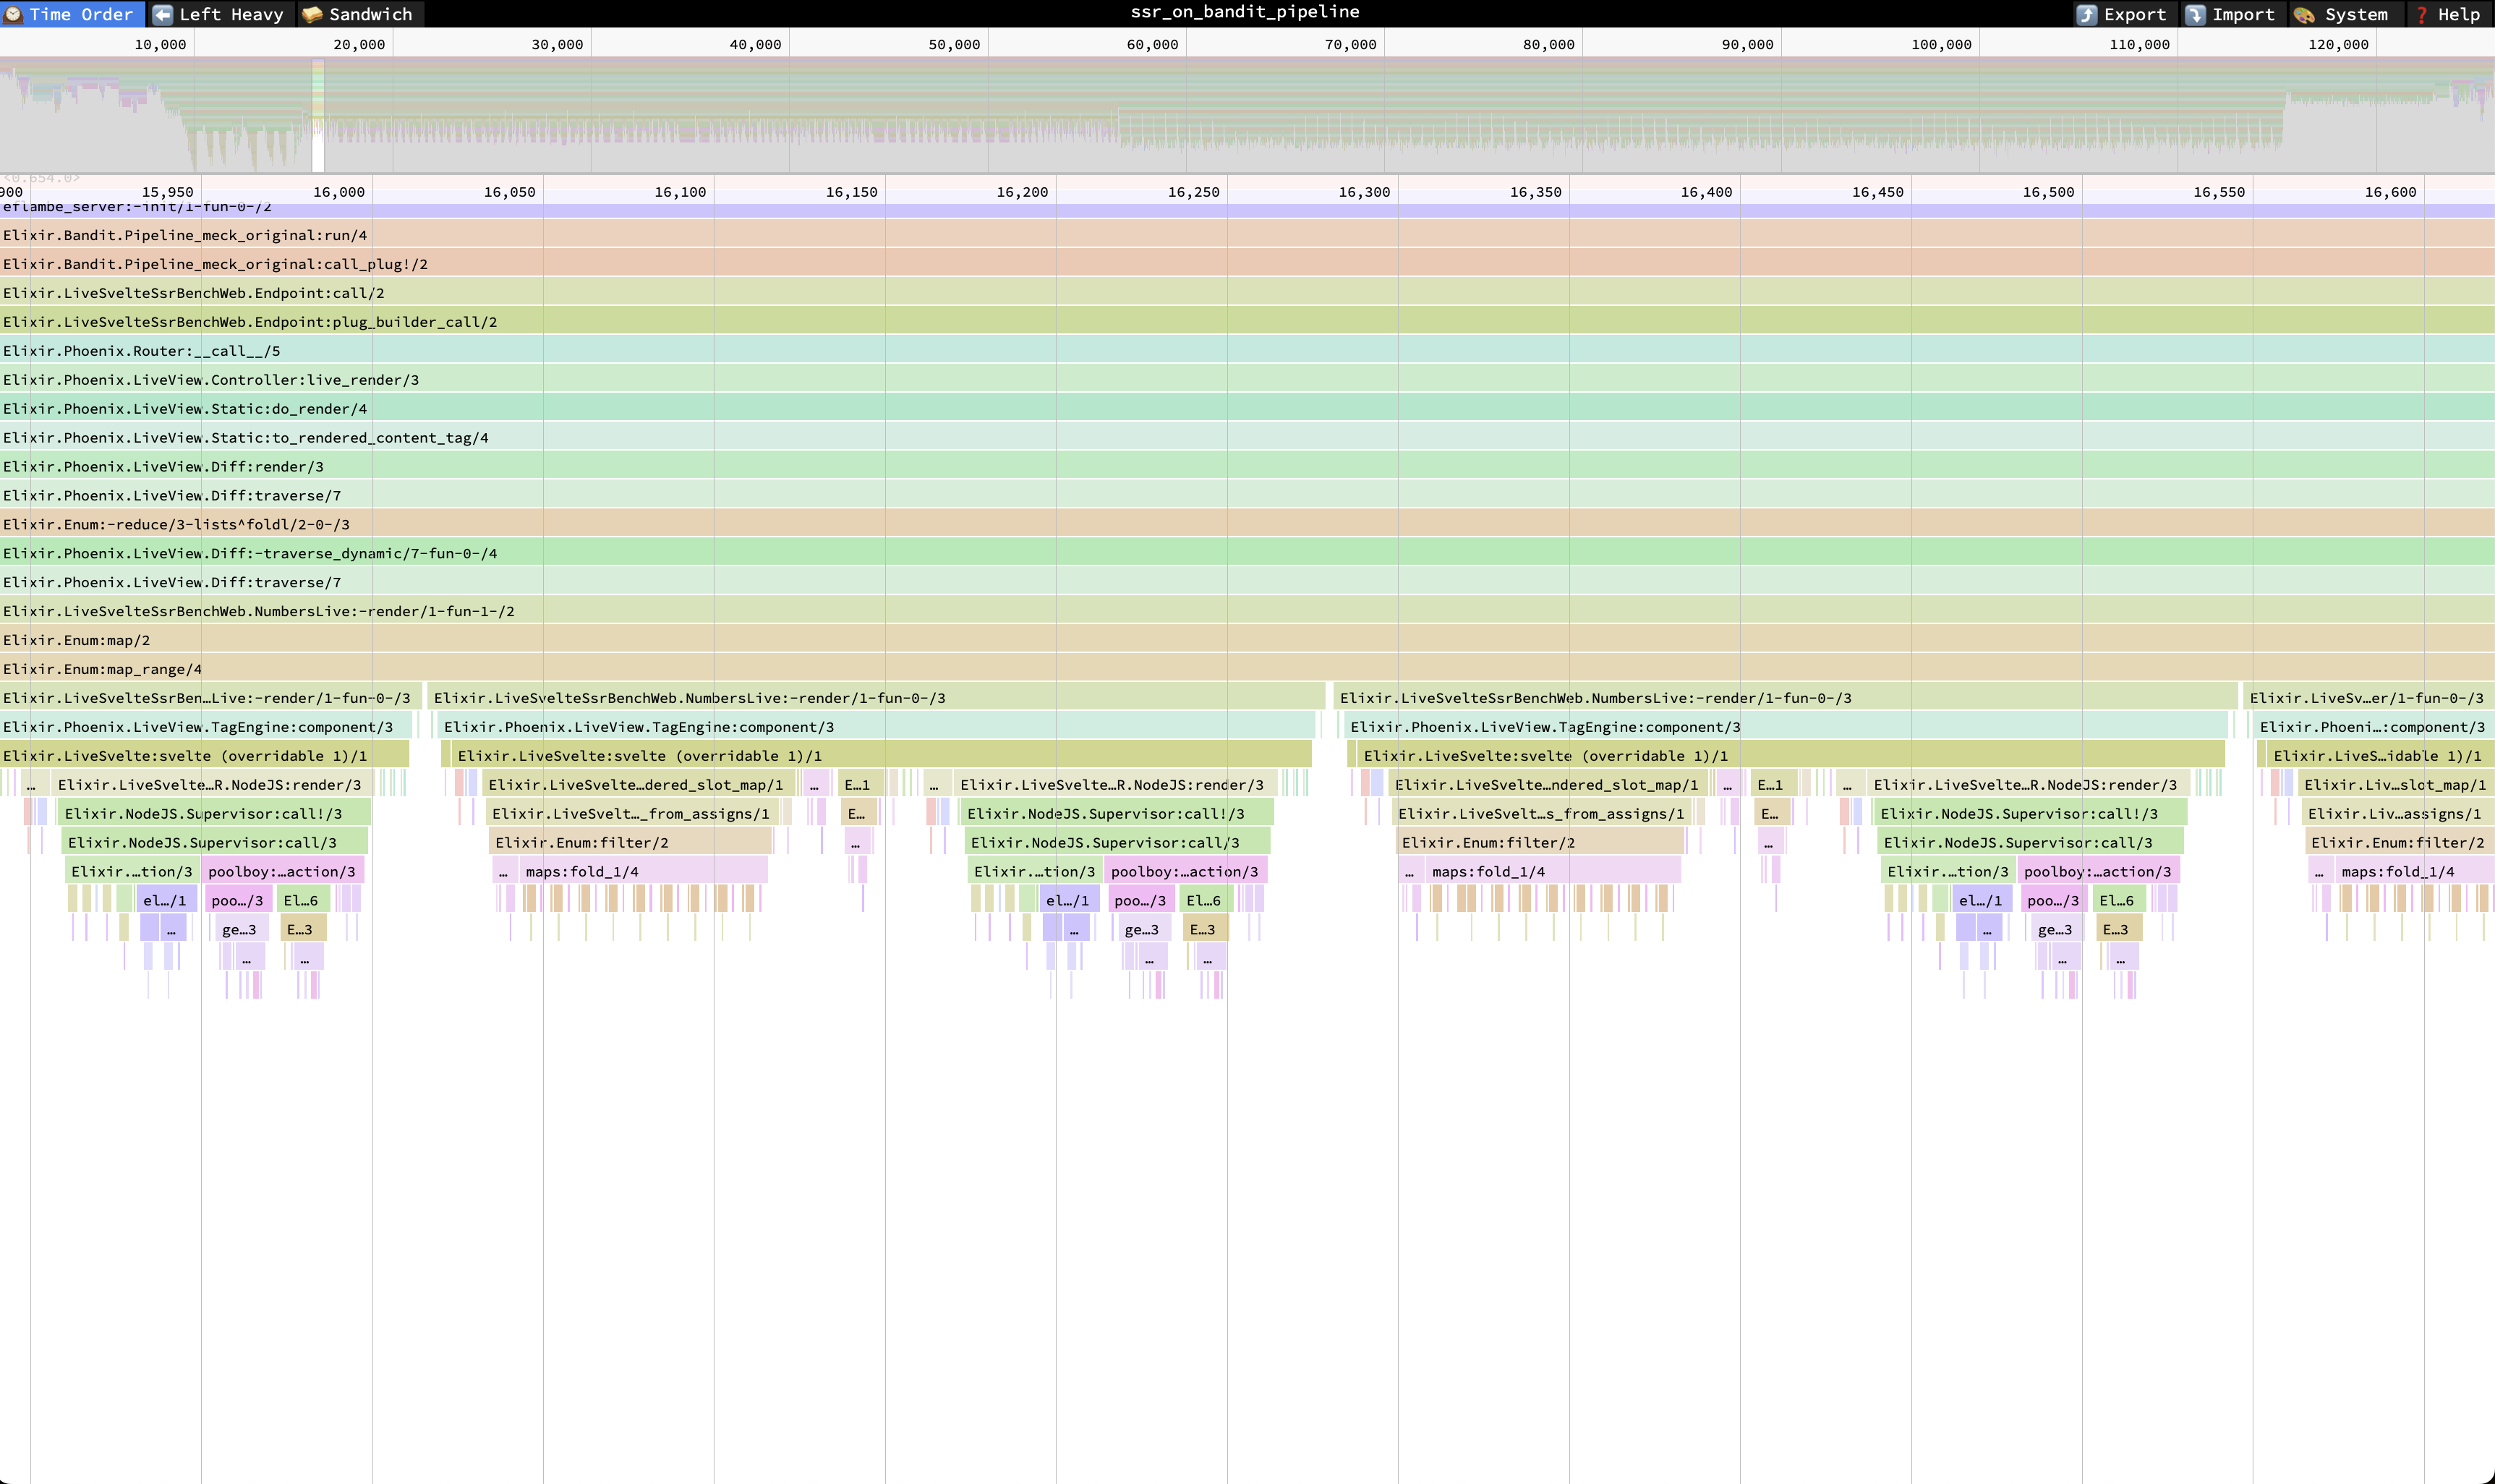
This repository helps visualise where time is spent when serving a request using live_svelte. It leverages eFlambè to generate flamegraphs. This is inspired by elixir_1brc.
Start by launching the server with IEx:
MIX_ENV=prod mix assets.deploy
MIX_ENV=prod iex -S mix phx.server
Next, specify the function you want to capture (e.g. an entire request):
:eflambe.capture({Bandit.Pipeline, :run, 4}, 1, [])Now, visit http://localhost:4000 in your browser. A .bggg file will be generated in the root directory. You can visualise it using Speedscope.
Only function calls within a single process are captured. If another process is called (e.g. using GenServer.call/2), the captured graph will show a sleep section while the calling process is waiting.
To gain a more comprehensive understanding, you can capture the function of the called process separately.
:eflambe.capture({NodeJS.Worker, :handle_call, 3}, 1, [])Then, visit http://localhost:4000 again to generate a new trace.
