Hyades, named after the star cluster closest to earth, is a proof-of-concept for decoupling responsibilities from Dependency-Track's monolithic API server into separate, scalable™ services. We're using Kafka (or Kafka-compatible brokers like Redpanda) for communicating between API server and Hyades services.
If you're interested in the technical background of this project, please refer to 👉 WTF.md 👈.
As of now, Hyades is capable of:
- Performing vulnerability analysis using scanners that leverage:
- Gathering component metadata (e.g. latest available version) from remote repositories
- Sending notifications via all channels supported by the original API server (E-Mail, Webhook, etc.)
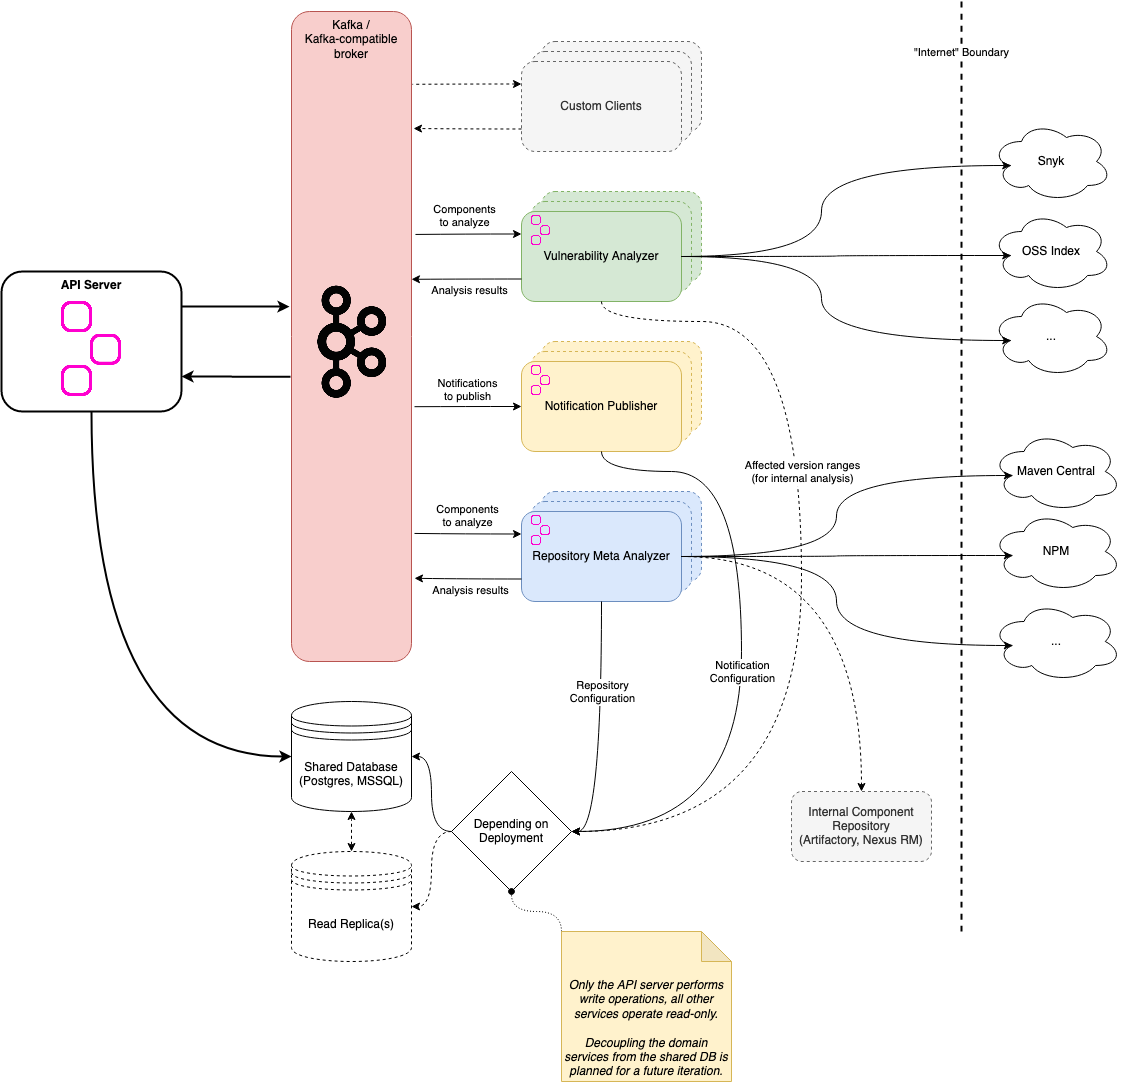
Here's a rough overview of the architecture:
To read more about the individual services, refer to their respective REAMDE.md:
Yes! We prepared demo setup that you can use to play around with Hyades.
Check out 👉 DEMO.md 👈 for details!
See CONFIGURATION.md.
- JDK 17+
- Docker
mvn clean install -DskipTestsRunning the Hyades services locally requires both a Kafka broker and a database server to be present. Containers for Redpanda and PostgreSQL can be launched using Docker Compose:
docker compose up -dTo launch individual services execute the quarkus:dev Maven goal for the respective module:
mvn -pl vulnerability-analyzer quarkus:devMake sure you've built the project at least once, otherwise the above command will fail.
Note
If you're unfamiliar with Quarkus' Dev Mode, you can read more about it here
To execute the unit tests for all Hyades modules:
mvn clean verifyNote
End-to-end tests are based on container images. The tags of those images are currently hardcoded. For the Hyades services, the tags are set tolatest. If you want to test local changes, you'll have to first:
- Build container images locally
- Update the tags in
AbstractE2ET
To execute end-to-end tests as part of the build:
mvn clean verify -Pe2e-allTo execute only the end-to-end tests:
mvn -pl e2e clean verify -Pe2e-allSee load-tests.
The recommended way to deploy Hyades is via Helm. Our chart is not officially published to any repository yet, so for now you'll have to clone this repository to access it.
The chart does not include:
- a database
- a Kafka-compatible broker
- the API server
- the frontend
While API server and frontend will eventually be included, database and Kafka broker will not.
Helm charts to deploy Kafka brokers to Kubernetes are provided by both Strimzi and Redpanda.
Deploying to a local Minikube cluster is a great way to get started.
Note
For now, services not included in the Helm chart are deployed using Docker Compose.
- Start PostgreSQL and Redpanda via Docker Compose
docker compose up -d- Start the API server and frontend
docker compose up -d apiserver frontend- Start a local Minikube cluster
minikube start- Deploy Hyades
helm install hyades ./helm-charts/ \
  -n hyades --create-namespace \
  -f ./helm-charts/hyades/values.yaml \
-f ./helm-charts/hyades/values-minikube.yamlA basic metrics monitoring stack is provided, consisting of Prometheus and Grafana.
To start both services, run:
docker compose --profile monitoring up -dThe services will be available locally at the following locations:
- Prometheus: http://localhost:9090
- Grafana: http://localhost:3000
Prometheus is configured to scrape metrics from the following services in a 5s intervals:
- Redpanda Broker
- API Server
- Notification Publisher
- Repository Meta Analyzer
- Vulnerability Analyzer
The Grafana instance will be automatically provisioned to use Prometheus as data source. Additionally, dashboards for the following services are automatically set up:
- Redpanda Broker
- API Server
- Vulnerability Analyzer
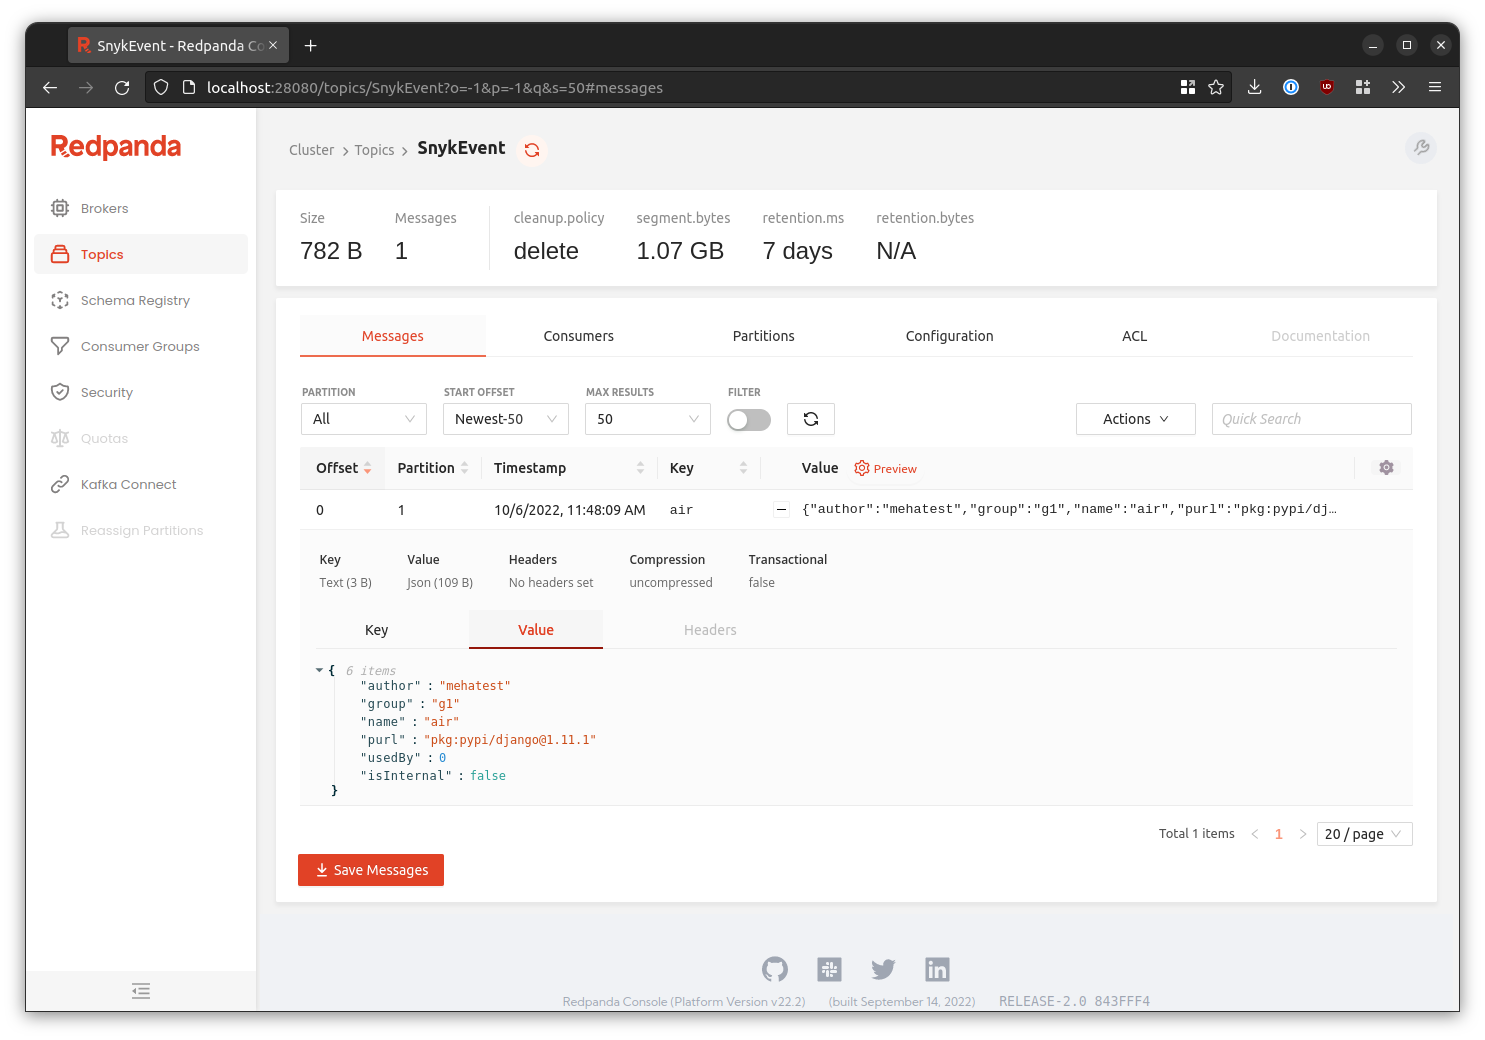
The provided docker-compose.yml includes an instance of Redpanda Console
to aid with gaining insight into what's happening in the message broker. Among many other things, it can be used to
inspect messages inside any given topic:
The console is exposed at http://127.0.0.1:28080 and does not require authentication. It's intended for local use only.

