tfjs-vis is a small library for in browser visualization intended for use with TensorFlow.js.
It's main features are:
- A set of visualizations useful for visualizing model behaviour
- A set of high level functions for visualizing objects specific to TensorFlow.js
- A way to organize visualizations of model behaviour that won't interfere with your web application
The library also aims to be flexible and make it easy for you to incorporate custom visualizations using tools of your choosing, such as d3, Chart.js or plotly.js.
You can install this using npm with
npm install @tensorflow/tfjs-vis
or using yarn with
yarn add @tensorflow/tfjs-vis
You can also load it via script tag using the following tag, however you need to have TensorFlow.js also loaded on the page to work. Including both is shown below.
<script src="https://cdn.jsdelivr.net/npm/@tensorflow/tfjs"> </script>
<script src="https://cdn.jsdelivr.net/npm/@tensorflow/tfjs-vis"></script>
To build the library, you need to have node.js installed. We use yarn
instead of npm but you can use either.
First install dependencies with
yarn
or
npm install
Then do a build with
yarn build
or
npm run build
This should produce a tfjs-vis.umd.min.js file in the dist folder that you can
use.
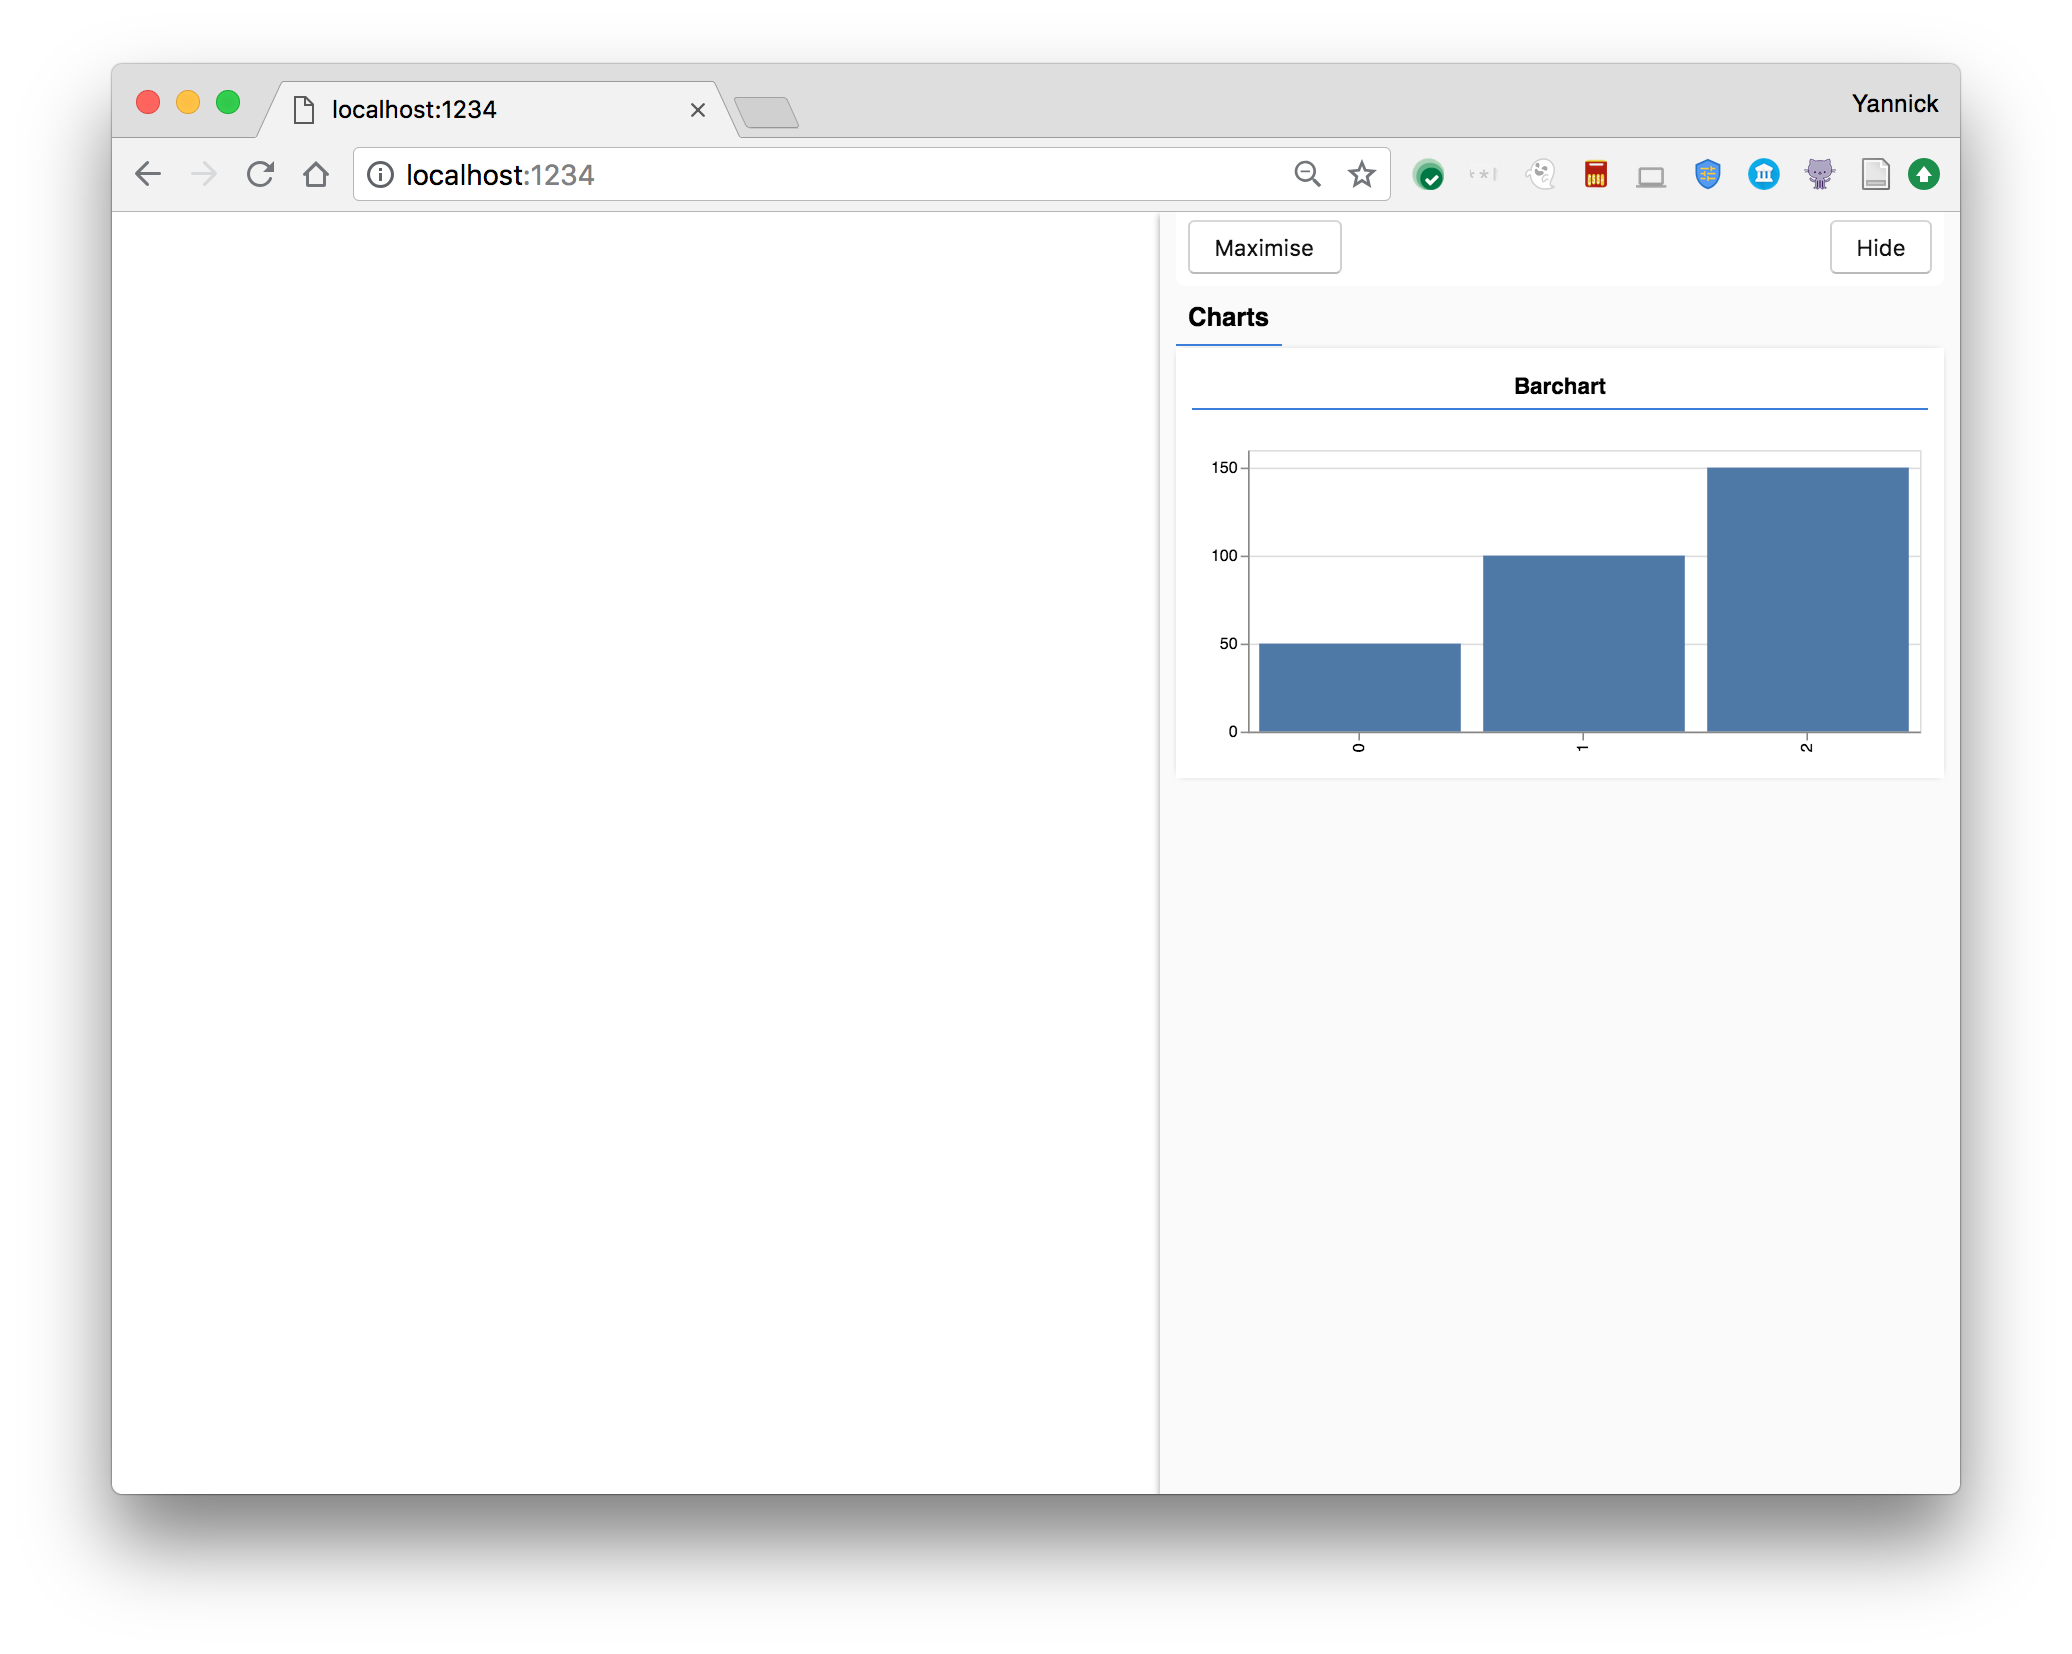
const data = [
  { index: 0, value: 50 },
  { index: 1, value: 100 },
  { index: 2, value: 150 },
];

// Get a surface
const surface = tfvis.visor().surface({ name: 'Barchart', tab: 'Charts' });

// Render a barchart on that surface
tfvis.render.barchart(surface, data, {});
This should show something like the following
Found a bug or have a feature request? Please file an issue on the main TensorFlow.js repository
See https://js.tensorflow.org/api_vis/latest/ for interactive API documentation.
