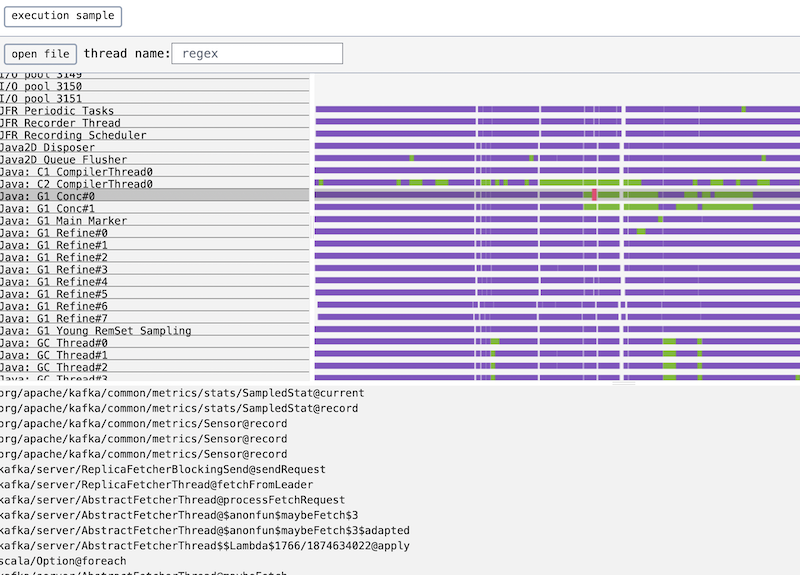
Web based Java Flight Recorder (JFR) file viewer.
Live demo: https://ocadaruma.github.io/jfrv
- Take wallclock profile of your application by
async-profiler$ /path/to/profiler.sh -e wall -t -f result.jfr -d 30 $PID
- Open the profile in jfrv
jfrv parses JFR files 100% on browsers using wasm-compiled Rust JFR reader jfrs.
There are various profiling tools for Java applications. The most widely used ones seem Java Flight Recorder (JFR) and async-profiler.
Though both are designed to be low-overhead so that can be run in the production environment, in my experience,async-profiler is much more efficient and safe to run even against high-load streaming middleware (like Kafka) without notable impact.
async-profiler supports output profiles in JFR-compatible format which contains per-thread samples with stack traces when the sample was recorded, so we can use it to check a very detailed threads timeline that greatly helps to investigate performance issues (particularly when the issue is due to contention between the threads).
However, existing JFR viewers seem to be not suitable for generating threads timeline of async-profiler-recorded files, so I needed another tool.
To build and run jfrv locally, execute below commands and visit localhost:8080.
# activate emsdk
$ source /path/to/emsdk/emsdk_env.sh
$ git submodule update --init --recursive
$ make -C duckdb-jfr-extension duckdb-wasm
$ yarn install --install-links
$ yarn serve