qnapexporter is a simple Go program meant to be run in the background on a QNAP NAS in order to export
relevant metrics to Prometheus. It exposes an HTTP /metrics endpoint which generates a standard Prometheus metrics file, and a /notifications endpoint which can simulate an SMSC endpoint for QNAP notifications.
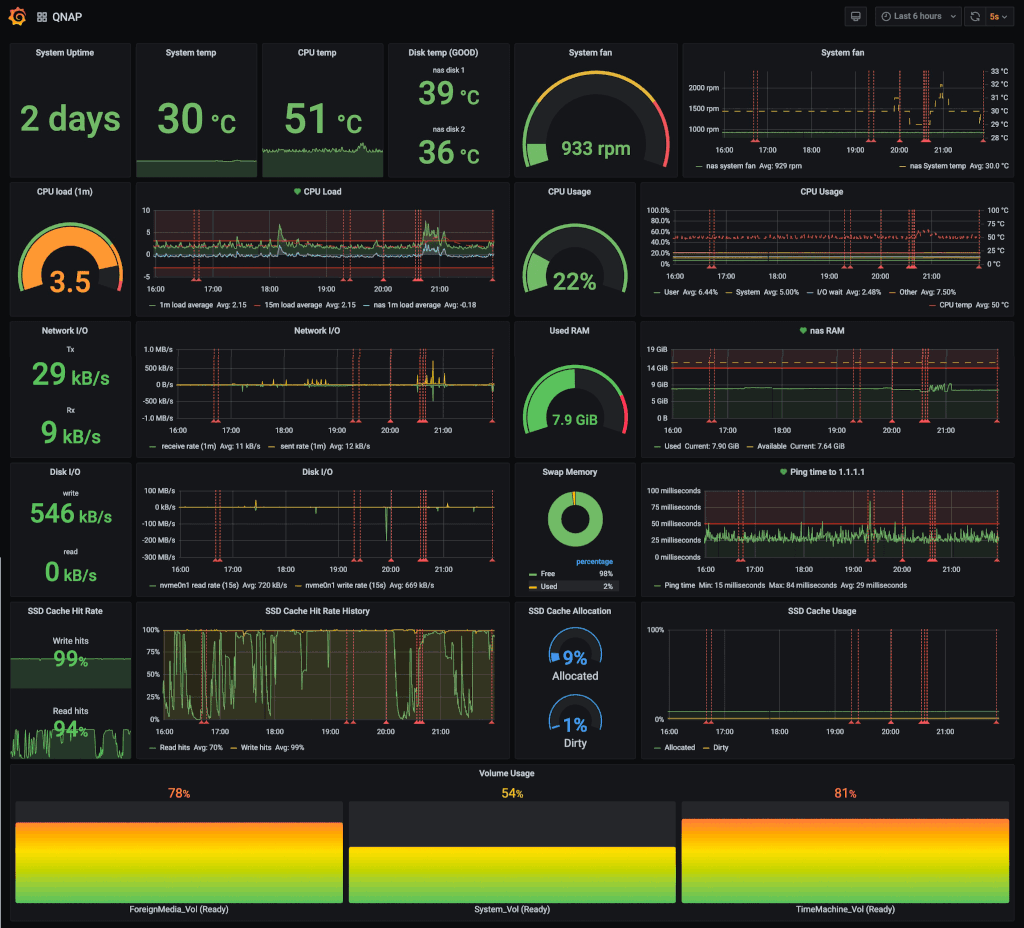
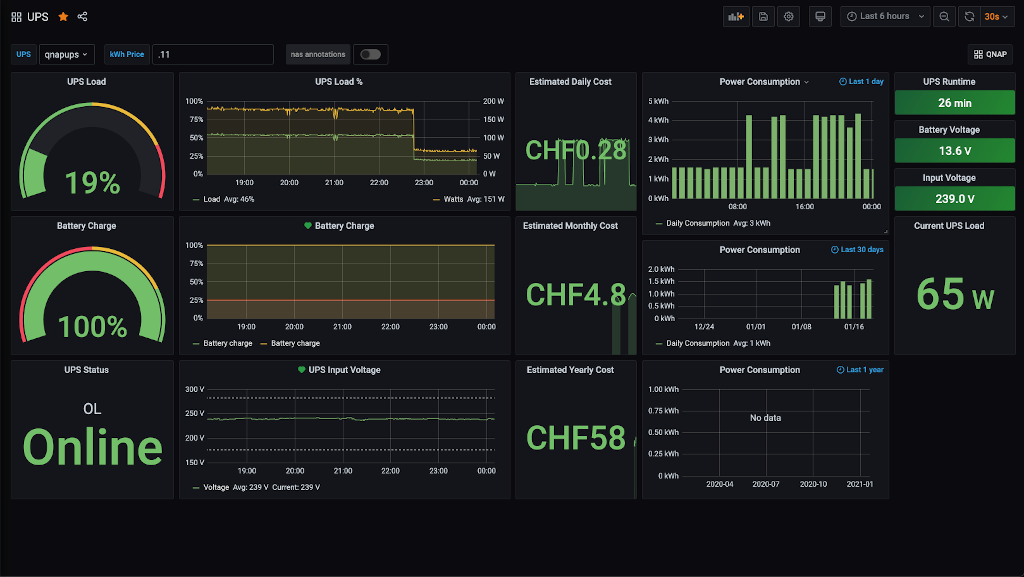
The data produced by this exporter can be used to create Grafana dashboards such as the following:
The Grafana dashboard sources are in the /dashboards directory.
-
Download the latest qnapexporter executable from the Releases page
-
Run
qnapexporter./qnapexporter
Normally it should be run as a background task. Unfortunately this is not easy on a QNAP NAS. See for example this forum post for ideas on how to achieve it.
- Download the latest qnapexporter qpkg package from the Releases page
- Via web ui in QNAP, use manual installation in App Center. Please note that the installation will issue a warning because the QPKG package is not signed. When the binary is installed via QPKG, it will automatically start as background task and can be also stopped/started via App Center.
Add target to scrape_configs section of prometheus.ini
```yaml
- job_name: 'qnap'
  scrape_interval: 10s
  honor_labels: true
  static_configs:
  - targets: ['localhost:9094']
```
qnapexporter supports the following command line flags:
| Flag | Default value | Description |
|---|---|---|
--port |
:9094 |
Address/port where to serve the metrics |
--ping-target |
1.1.1.1 |
Host to periodically ping |
--healthcheck |
N/A | Healthcheck service to ping every 5 minutes (currently supported: healthchecks.io:<check-id>) |
--grafana-url |
N/A | Grafana host (e.g.: https://grafana.example.com), also settable through GRAFANA_URL environment variable |
--grafana-auth-token |
N/A | Grafana API token for annotations, also settable through GRAFANA_AUTH_TOKEN environment variable |
--grafana-tags |
nas |
List of Grafana tags for annotations, also settable through GRAFANA_TAGS environment variable |
--log |
N/A | Path to log file (defaults to standard output) |
qnapexporter can expose QNAP events as Grafana annotations, to make it easy to understand what is happening on the NAS. To configure the support:
- Log in to the NAS web interface
- Open
Notification Center, thenService Account and Device Pairing - In the
SMStab, click theAdd SMSC Servicebutton- In
SMS service provider, selectcustom - Set
Aliastoqnapexporter - Set
URL template texttohttp://localhost:9094/notification?phone_number=@@PhoneNumber@@&text=@@Text@@. Customize the port to match whatever is passed to--port. - Confirm the settings.
- In
- In the Grafana web UI, go to
Configuration,API Keys- Press
Add API key - Set
Key nametoqnapexporter - Set
RoletoEditor - Press
Add - Take note of the created token (this will be passed to qnapexporter with
--grafana-auth-token)
- Press
The root endpoint exposes information about the current status of the program (useful for debugging):


