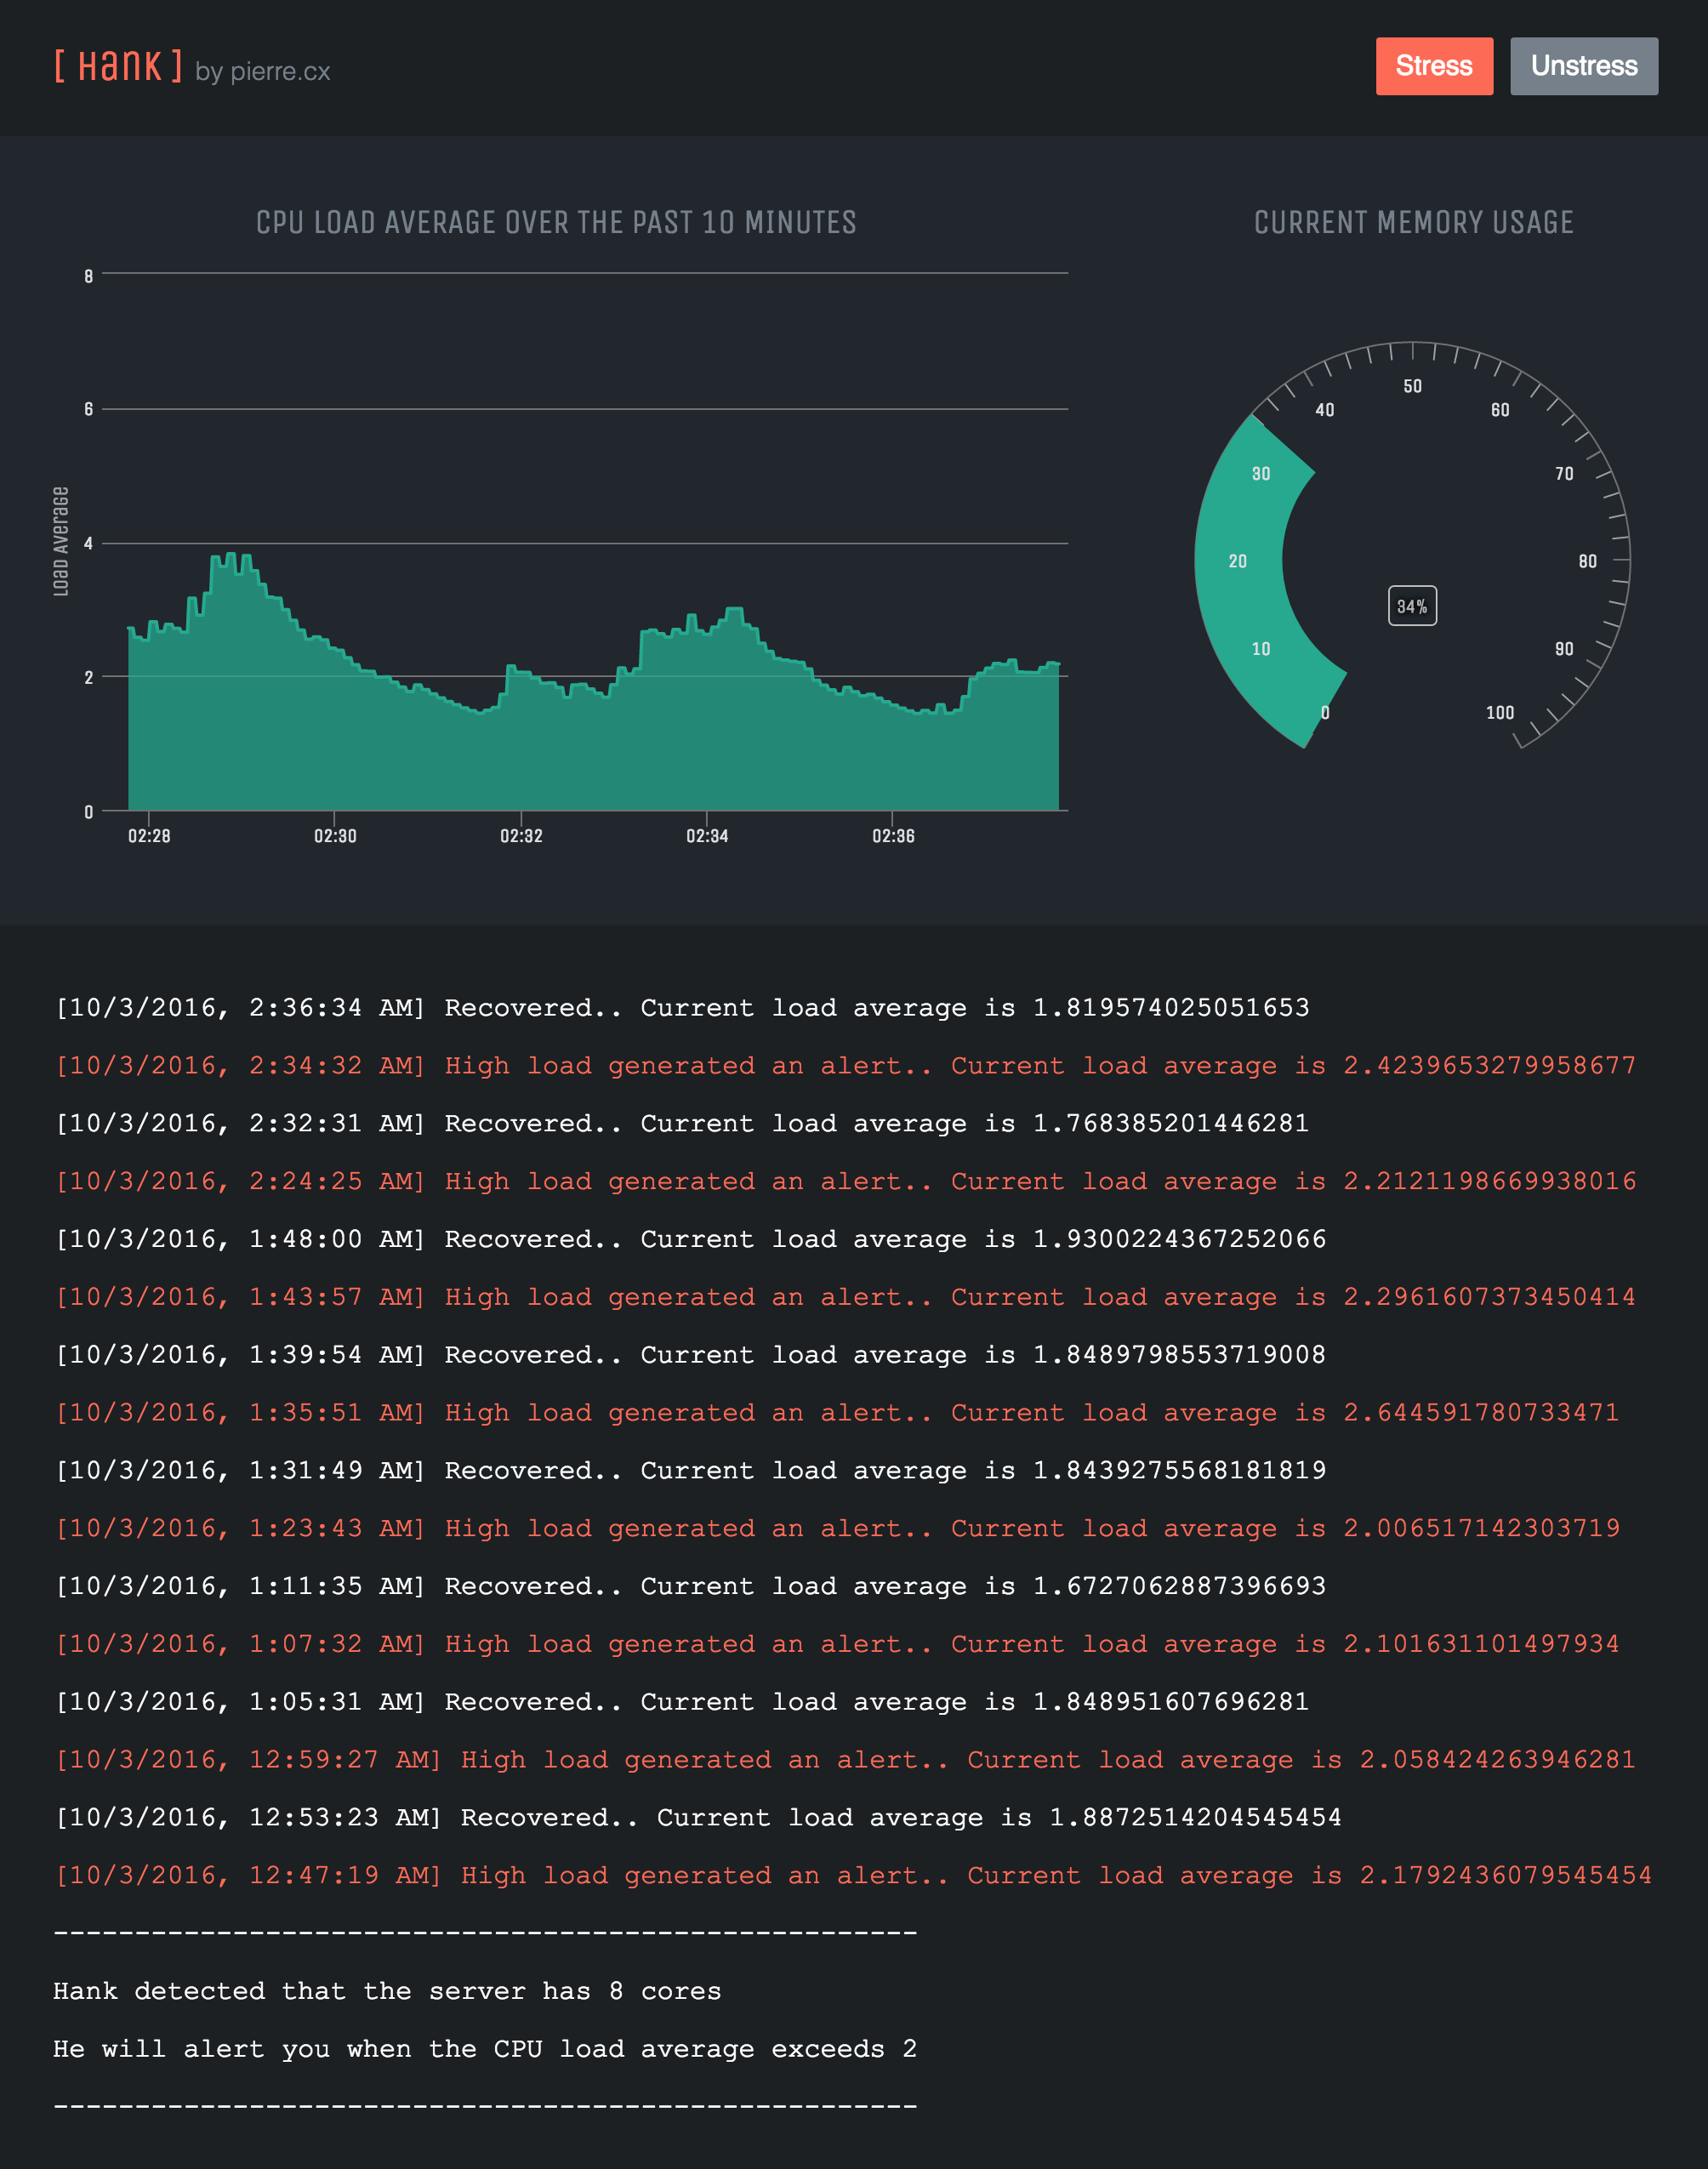
Live OS monitoring UI built on top of HighCharts.js
Hank will alert you when your CPU starts cooking.
git clone [email protected]:pierrecholhot/hank.git
cd hank
npm install
npm start
Then navigate to http://localhost:3000/
npm run dev
npm run lint
npm test
Senior FE web developer in a major web agency in Paris for the past 5 years. Fast learner but not a "graph expert".
- node.js
- express.js
- os-monitor
- socket.io
- highcharts.js
- webpack
- ES6 / babel
- postCss
- cssNext
One of the things that distinguish experienced Front-End developers from others, is their ability to correctly assert certain needs for projects. That being said, I won't use X or Z just because I know how to use them.
React is fun, I will probably find a good use for it in most of my future projects. But we are smart people, right? Do we really need React? How will React help us on this specific task? IMHO, React is mainly for -out of the box- good performance, re-usable components and for "easier" maintenance.
I couldn't see a fit for React here. I saw it on this other project =)
Simplicity VS Robustness.
Since this project has a really "tiny" scope, I also felt that D3 would be an overkill here.
AFAIK, D3 would be a nice base for building "complex" dashboards with lots of graphs.
For this specific task, I decided that I would use Highcharts.js for the sake of -again- simplicity.
I never worked on live graphs before ; D3 learning curve worried me at a first glance. I would have gave it another shot if I could have allocated more time for this task.
And hey, Highcharts update method is quite easy-to-use compared to D3 update patterns =)
Node is a non-negotiable dependency when developing a project. We know javascript and we should leverage this.
I personally can't stand the idea of people who still use MAMP.
And yes, sometimes, python's simpleHTTPserver can do the job when working on static pages.
I am a big fan of "using what's already available out there".
I could have exec('uptime') in a setInterval, but well, someone already did that for us.
I needed to find a way to "stress test" the OS in order to test my alerting system.
I couldn't find any NPM packages that would help me accomplish this. Maybe I wasn't using the right keywords.
I then stackoverflow'd it and ended up with a one-liner shell cmd (cat /dev/zero > /dev/null). I have no idea what side effects it has and would never do that in a production env.
- Add some more robust test cases. IE use spies to make sure the correct functions were invoked.
- Store Alerts history and recentEvents in a Database rather than in the memory
- Recent events over the past 2 minutes are duplicated in our 10 minutes history array. Should find those 2 minutes within our 10 minutes data.
- Add
postCSS importplugin and externalize css variables in another file.import normalize.cssinindex.cssrather than inindex.js - Stick to the functional programming paradigm used here. Make sure all functions stay "pure".
I couldn't help noticing that there were a bunch of os monitoring scripts on github. Mainly made by developers for this specific interview question.
It was interesting seeing these different approaches.
https://github.com/mattgrannary/wd-monitor
https://github.com/kennethdavidbuck/snoopdog
https://github.com/tyleraadams/load_monitoring
https://github.com/atneik/Load-Monitor
https://github.com/brettimus/goat-monitoring-app
https://github.com/roadhomegames/load_monitor
and much more..
Create a simple web application that monitors load average on your machine:
- Collect the machine load (using “uptime” for example)
- Display in the application the key statistics as well as a history of load over the past 10 minutes in 10s intervals. We’d suggest a graphical representation using D3.js, but feel free to use another tool or representation if you prefer. Make it easy for the end-user to picture the situation!
- Make sure a user can keep the web page open and monitor the load on their machine.
- Whenever the load for the past 2 minutes exceeds 1 on average, add a message saying that “High load generated an alert - load = {value}, triggered at {time}”
- Whenever the load average drops again below 1 on average for the past 2 minutes, Add another message explaining when the alert recovered.
- Make sure all messages showing when alerting thresholds are crossed remain visible on the page for historical reasons.
- Write a test for the alerting logic
- Explain how you’d improve on this application design
pierre.cx
