/docs: An offline version the API documentation HTML pages.
/samples: A collection of feature by feature samples. We suggest you start with the How Do I Sample as it shows dozens of features in one easy to navigate app.
/assets: Any assets needed for the readme.md.
README.md: A quick start guide to show you how to quickly get up and running.
This section will introduce you to getting a nice looking map up and running with some external data and styling. After reviewing this we strongly recommend that you open the How Do I Sample. It's packed with dozens of examples covering nearly everything you can do with the control.
We will begin by creating a .NET Core WPF project in your favorite editor. Next we will walk you through adding the required packages and getting a map on the default form. Next we will add some code to show a nice looking background map and finally add some custom which will be styled and labeled. After reading this you will be in a good position to look over the How Do I Sample and explore our other features.
In your editor of choice you need to create a .NET Core WPF project. Please see your editor's instructions on how to create the project. Here is a sample video using Visual Studio for reference.
You will need to install the ThinkGeo.UI.Wpf NuGet package. We highly suggest you use your editors built in NuGet package manager if possible. If you're not using an IDE you can install it via the the dotnet CLI from inside your project folder where where your project file exists.
dotnet add package ThinkGeo.UI.WpfAdd the new namespace to the MainWindow.xaml existing XAML namespaces.
xmlns:uc1="clr-namespace:ThinkGeo.UI.Wpf;assembly=ThinkGeo.UI.Wpf"Add the control to MainWindow.xaml file inside the Grid element.
<uc1:MapView x:Name="mapView" Loaded="mapView_Loaded"></uc1:MapView>Add the required usings.
using ThinkGeo.Core;
using ThinkGeo.UI.Wpf;
Setup the mapView_Loaded event which will run when the map control is finished being loaded.
private void mapView_Loaded(object sender, RoutedEventArgs e)
{
    // Set the Map Unit.
    mapView.MapUnit = GeographyUnit.Meter;
}Add the code below to the mapView_Loaded event of the MainWindow.xaml.cs.
    // Set the Map Unit.
    mapView.MapUnit = GeographyUnit.Meter;

    // Add a base map overlay.
    var cloudVectorBaseMapOverlay = new ThinkGeoCloudVectorMapsOverlay("USlbIyO5uIMja2y0qoM21RRM6NBXUad4hjK3NBD6pD0~", "f6OJsvCDDzmccnevX55nL7nXpPDXXKANe5cN6czVjCH0s8jhpCH-2A~~", ThinkGeoCloudVectorMapsMapType.Light);
    mapView.Overlays.Add(cloudVectorBaseMapOverlay);

mapView.CurrentExtent = new RectangleShape(-20000000, 20000000, 20000000, -20000000);The first time you run your application, you will be presented with ThinkGeo's Product Center which will create and manage your licenses for all of ThinkGeo's products. Create a new account to begin a 60-day free evaluation.
- Run the application in Debug mode.
- Click the "Create a new Account?" link.
- Fill out your name, email address, password and company name and click register.
- Check your email and click the "Active Your Account" link.
- Return to Product Center and login using the credentials your just created and hit "Continue Debugging" button.
You should now see your map with our Cloud Maps layer!
Now that you have a basic setup, you can add custom data to the map. Depending on the data, this can be complex or quite simple. We'll be going over the simple basics of adding custom data, with a pitfall or two to help you better understand how our framework can help you get around these issues.
Download the WorldCapitals.zip shapefile data and unzip it in your project under a new folder called AppData. Make sure that the files are set to copy to the build output directory. From there, we can add the shapefile to the map.
    // Add a shapefile layer with point style.
    var capitalLayer = new ShapeFileFeatureLayer(@"AppData/WorldCapitals.shp");

    // Create an overlay to add the layer to and add that overlay to the map.
    var customDataOverlay = new LayerOverlay();
    customDataOverlay.Layers.Add(capitalLayer);
mapView.Overlays.Add(customDataOverlay);We won't be able to see the points until a style is defined for it. Adding a style though is very straightforward, but extremely extensible and powerful.
 var capitalStyle = new PointStyle()
    {
        SymbolType = PointSymbolType.Circle,
        SymbolSize = 8,
        FillBrush = new GeoSolidBrush(GeoColors.White),
        OutlinePen = new GeoPen(GeoColors.Black, 2)
    };

    capitalLayer.ZoomLevelSet.ZoomLevel01.DefaultPointStyle = capitalStyle;
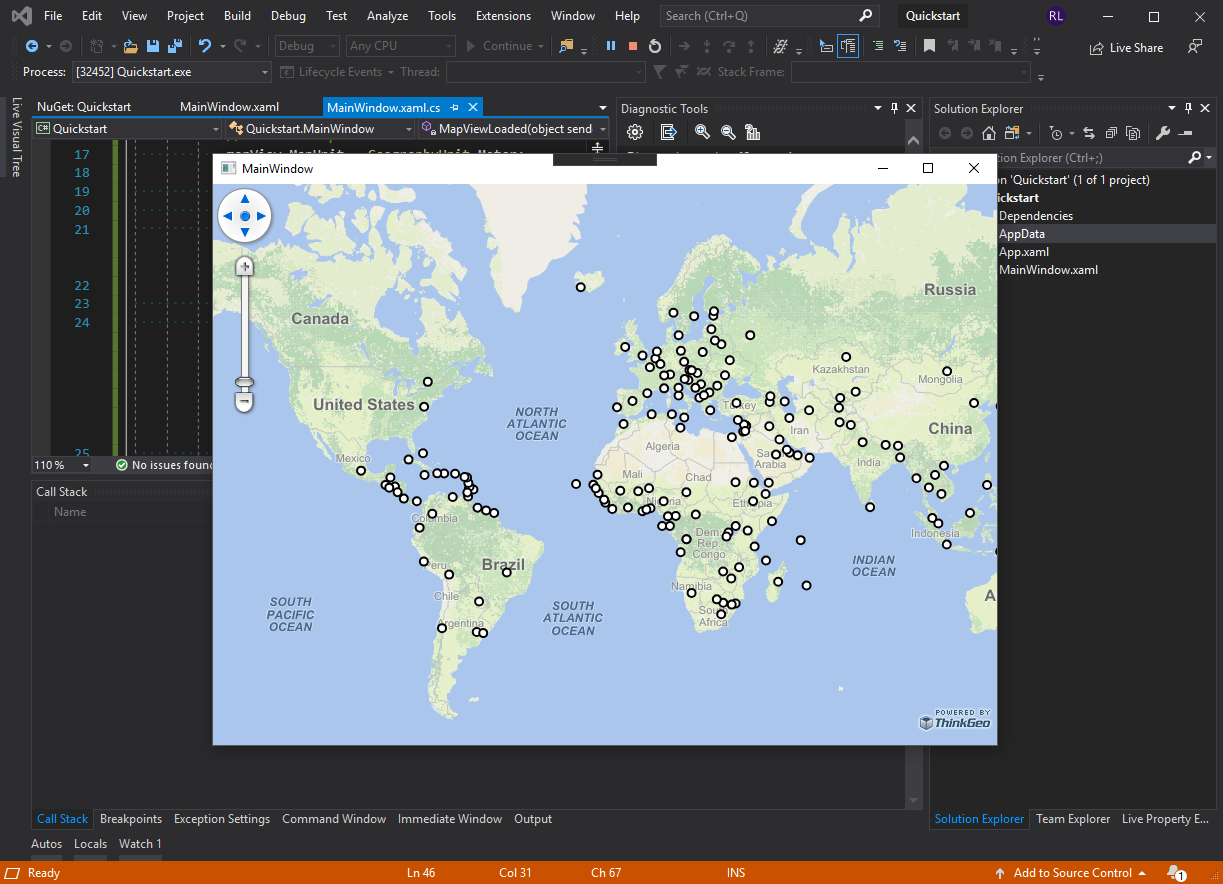
capitalLayer.ZoomLevelSet.ZoomLevel01.ApplyUntilZoomLevel = ApplyUntilZoomLevel.Level20;If you run the app now, you'll notice that there is just a single point shape in the center of the map! This is because the data is in a completely different projection from the map. We can easily fix that, though, by adding a ProjectionConverter to the layer from Decimal Degrees(4326) to Spherical Mercator(3857).
    // Set the projection of the capitalLayer to Spherical Mercator
    capitalLayer.FeatureSource.ProjectionConverter = new ProjectionConverter(4326, 3857);
Now, the data shows up properly on the map!
Now, we can make the map zoom into an area based on the extent of the data we added above. In order to do that, we must first open the layer for spatial queries to be made.
   // Open capitalLayer for it to be ready for spatial queries. Then, set the extent of the map to the full view of the data.
    capitalLayer.Open();
mapView.CurrentExtent = capitalLayer.GetBoundingBox();You now know the basics of using the ThinkGeo Map controls and are able to get started adding functionality into your own applications. Let's recap what we have learned about the object relationships and how the pieces of ThinkGeo UI work together:
- It is of the utmost importance that the units (feet, meters, decimal degrees, etc.) be set properly for the Map control based on the data.
- FeatureLayers provide the data used by a Map control to render a map.
- A Map is the basic control that contains all of the other objects that are used to tell how the map is to be rendered.
- A Map has many layers. A Layer correlates one-to-one with a single data source and typically of one type (point, polygon, line etc).
- A FeatureLayer can have several ZoomLevels. ZoomLevels help to define ranges (upper and lower) of when a Layer should be shown or hidden.
You are now in a great position to look over the How Do I Sample and explore our other features.
