How to use DVC pipelines and vscode notebook extensions to run Data Science experiments in Python
This is a repo that was done for a lecture for PyData Bristol on 10.2022 and for Data Bristol on 03.2023.
This repo has the materials for a simple DVC pipeline and how to monitor results using VSCode notebook extension - check changes.
git clone https://github.com/polecat-dev/talk-dvc-vscode.git
cd talk-dvc-vscode
poetry shell
pip install --upgrade pip
poetry install (installing dependencies)
python scripts/init_files.py
dvc repro
Go to results.
Define your kernel (with the poetry virtualenv).
Run all cells.
Save notebook changes.
Go to source control VSCode extension to check results changes.
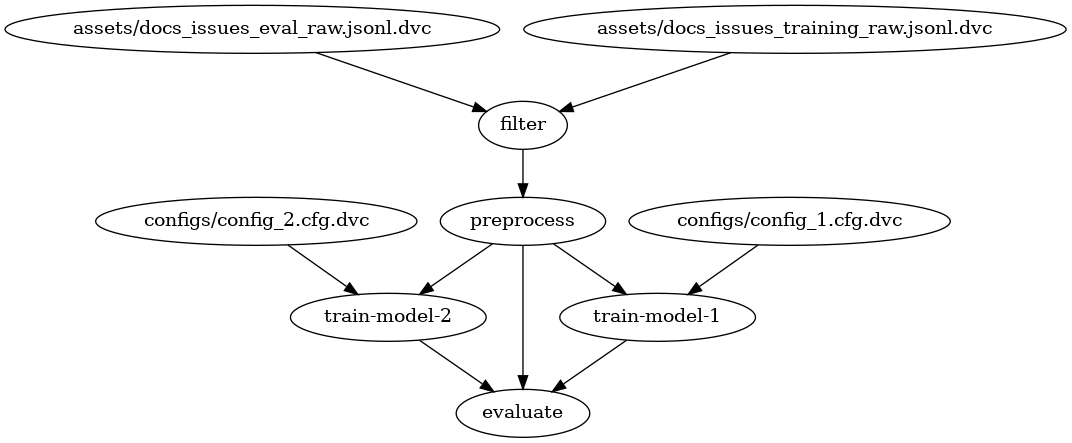
You can explore the pipeline in the dvc.yaml. To generate the graph visualization above, run:
poetry run dvc dag --dot | dot -Tpng > dag.png
Thanks to PyData Bristol & Data Bristol for the talk opportunity.
Thanks to Polecat for the time and information sharing.
Thanks to SpaCy for the materials.
Thanks to DVC.
Maintainer - Alon Samuel.
