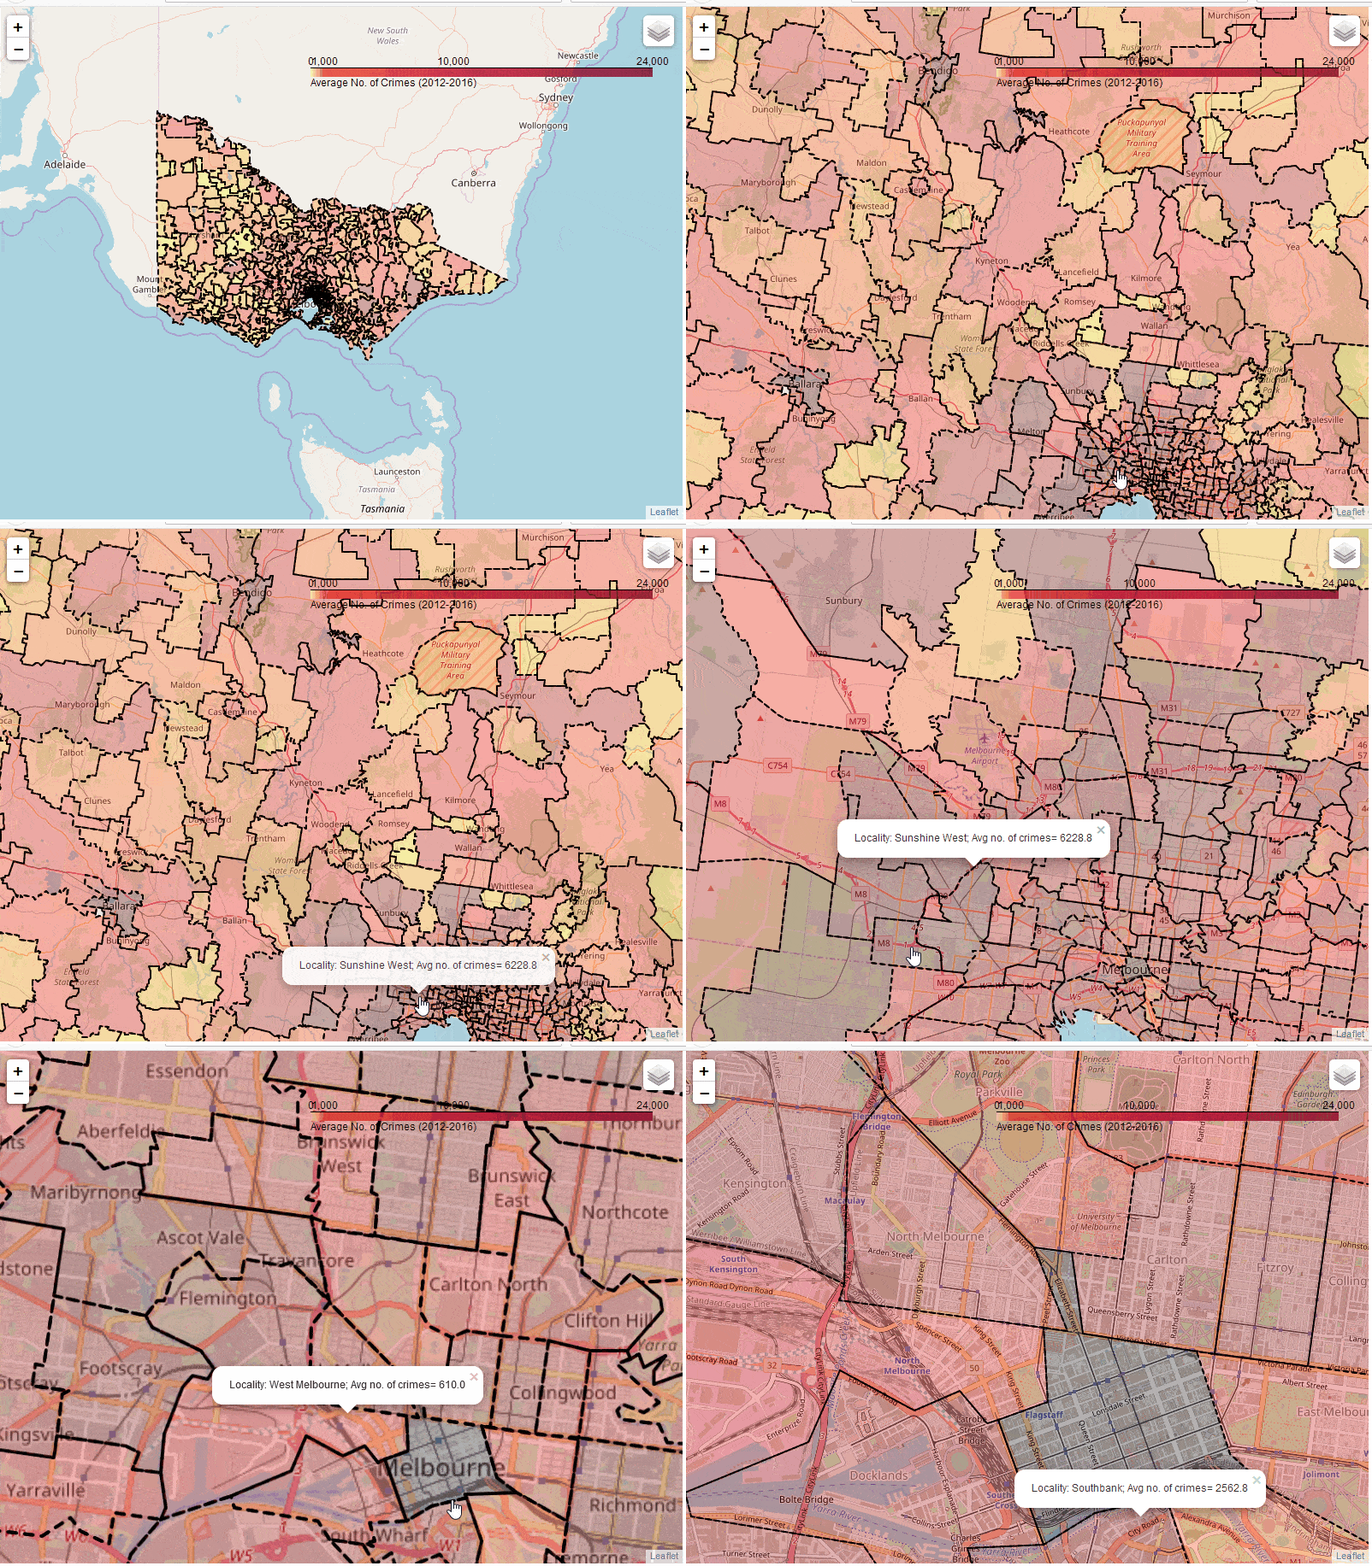
This is a static map showing the average number of crimes by each postcode using a colorscale.
This inspired me to try an Interactive version.
You can view the interactive map by downloading the html file. It is made using folium. Downloaded the shape file for the postcode boundaries of the state of Victoria from the Australian DataVic website
Converted it into json format using pyshp and also this website
View the Jupyter notebook here

