Violin plot is a method for plotting numeric data using a rotated/mirrored kernel density plot. Other implementations exist (namely from ggplot2) that provide extensive customization. This package provides an alternative implementation that relies solely on base graphics, yet still provides methods for data.frame, matrix, list, numeric vectors, and formula.
There is another base-graphics implementation of violin plots, here, but it hasn't been updated since 2005 and its URL link is dead. It does not support all of the methods and functionality that this package supplies. (Edit: since I wrote this package, vioplot has been updated. While I'm using this package without problem, I've had no immediate need to compare features.)
Note in 2020: don't be alarmed that there have been no significant edits in several years, it still works well with base graphics and R-4.0.2 (my current version).
It's not yet submitted to CRAN, so the only option currently is to import the development version from github:
devtools::install_github("r2evans/violinplot")library(violinplot)Anything (I think) that works for boxplot also works for violinplot:
violinplot(mtcars$mpg, main = "Single Vector")
violinplot(mtcars$mpg, mtcars$cyl, col = 2:4,
           main = "Two Vectors")
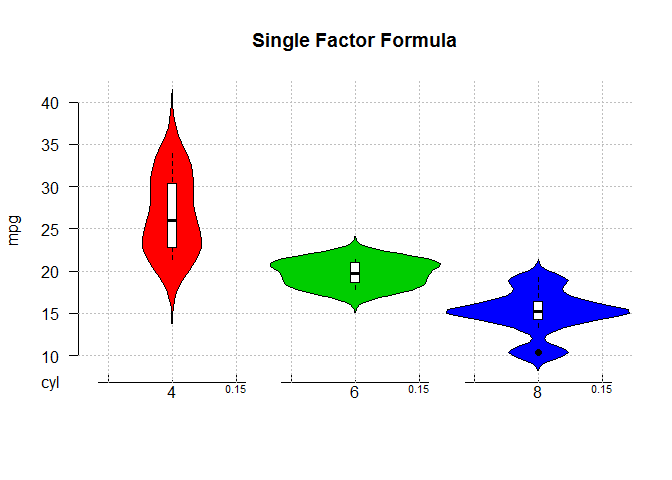
And, though boxplot already supports a "formula" method, the violinplot.formula method has been extended to provide spacing between the groups of factors:
violinplot(mpg ~ cyl, data = mtcars, col = 2:4,
           main = "Single Factor Formula")
More complex formulas can be used as well:
violinplot(mpg ~ cyl + vs, data = mtcars, col = 2:4,
           main = "Multi-Factor Formula")
