The following describes how to configure Prometheus and Grafana to gather metrics from Artifactory and Xray through the use of FluentD. The setup and configuration of Prometheus and Grafana uses Kubernetes and makes use of the Prometheus Community helm chart.
| version | artifactory | xray | distribution | mission_control | pipelines |
|---|---|---|---|---|---|
| 0.8.0 | 7.11.5 | 3.8.6 | N/A | N/A | N/A |
| 0.7.2 | 7.10.2 | 3.8.6 | N/A | N/A | N/A |
| 0.7.1 | 7.10.2 | 3.8.6 | N/A | N/A | N/A |
| 0.6.1 | 7.7.8 | 3.8.6 | N/A | N/A | N/A |
| 0.6.0 | 7.7.8 | 3.8.6 | N/A | N/A | N/A |
| 0.5.0 | 7.7.3 | 3.8.0 | N/A | N/A | N/A |
| 0.4.0 | 7.7.3 | 3.8.0 | N/A | N/A | N/A |
| 0.3.0 | 7.7.3 | 3.8.0 | N/A | N/A | N/A |
| 0.2.0 | 7.7.3 | 3.8.0 | N/A | N/A | N/A |
| 0.1.1 | 7.6.3 | 3.6.2 | N/A | N/A | N/A |
The Prometheus Community kube-prometheus-stack helm chart allows the creation of Prometheus instances and includes Grafana. Install via Helm 3:
Add the Helm Repositories:
helm repo add prometheus-community https://prometheus-community.github.io/helm-charts
helm repo update
Install the chart via Helm 3:
helm install jfrog-prometheus prometheus-community/kube-prometheus-stack --set prometheus.prometheusSpec.serviceMonitorSelectorNilUsesHelmValues=false
Install the chart via Helm 2:
helm install --name jfrog-prometheus prometheus-community/kube-prometheus-stack --set prometheus.prometheusSpec.serviceMonitorSelectorNilUsesHelmValues=false
These additional charts are installed:
- stable/kube-state-metrics
- stable/prometheus-node-exporter
- grafana/grafana
Install Artifactory or Artifactory-ha using the artifactory-values.yaml or artifactory-ha-values.yaml file.
You can apply them to your helm install of Artifactory such as below:
Artifactory
helm upgrade --install artifactory-ha  jfrog/artifactory-ha \
       --set artifactory.masterKey=$MASTER_KEY \
       --set artifactory.joinKey=$JOIN_KEY \
       -f artifactory-values.yaml
Artifactory-HA
helm upgrade --install artifactory-ha  jfrog/artifactory-ha \
       --set artifactory.masterKey=$MASTER_KEY \
       --set artifactory.joinKey=$JOIN_KEY \
       -f artifactory-ha-values.yaml
This will complete all the necessary configuration and expose a new service monitor servicemonitor-artifactory to expose metrics to Prometheus.
The environment variable JF_PRODUCT_DATA_INTERNAL must be defined to the correct location.
Helm based installs will already have this defined based upon the underlying docker images.
For non-k8s based installations below is a reference to the Docker image locations per product. Note these locations may be different based upon the installation location chosen.
Artifactory:
export JF_PRODUCT_DATA_INTERNAL=/var/opt/jfrog/artifactory/
Xray:
export JF_PRODUCT_DATA_INTERNAL=/var/opt/jfrog/xray/
The following steps describe how to configure FluentD to gather metrics for Prometheus.
- Install the FluentD Prometheus Plugin.
- Use the appropriate FluentD configuration file and copy it to /etc/td-agent/td-agent.conf.
- fluent.conf.rt - Artifactory version 7 server
- fluent.conf.rt6 - Artifactory version 6 server
- fluent.conf.xray - Xray server (3.x+)
- Restart td-agent.
- In order to expose the /metrics interface for Prometheus to scrape, apply the appropriate *-metrics-service.yaml.
eg.
kubectl apply -f artifactory-ha-member-metrics-service.yaml
The following steps create ServiceMonitor(s) to gather metrics. The ServiceMonitor resource tells Prometheus where the metrics service. This metrics service provides the metrics data for the Prometheus "scrapes".
- Create the appropriate ServiceMonitor for your JFrog servers to gather metrics.
kubectl apply -f servicemonitor-*.yaml

eg.
kubectl apply -f servicemonitor-artifactory-ha-member.yaml
- Go to the web UI of the Prometheus instance create in Step 1 and verify the Targets list shows the new ServiceMonitor.
 __
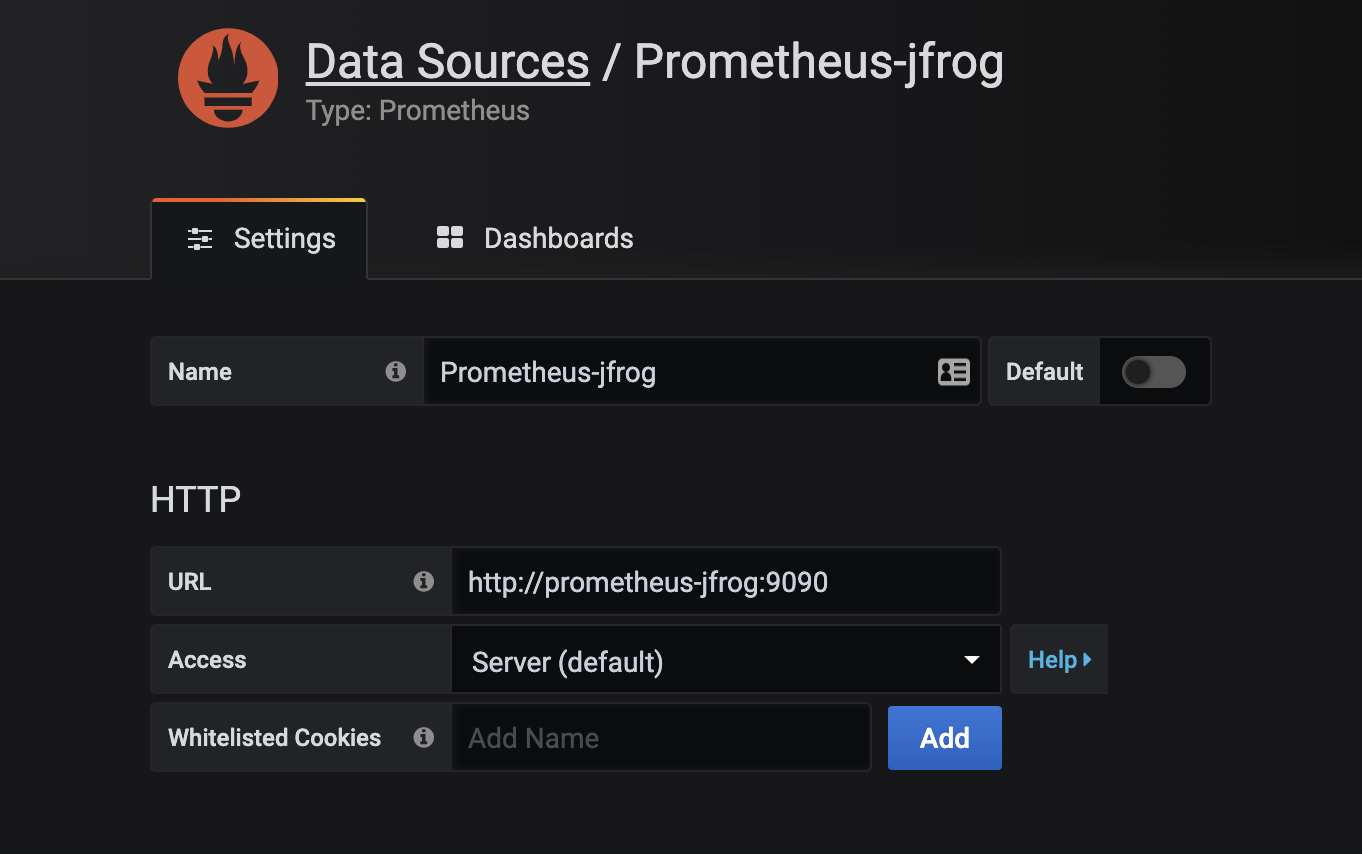
__ - Finally, go to Grafana to add your Prometheus instance as a datasource.

For production use, the metrics interfaces provided by the FluentD Prometheus Plugin should be secured using TLS. This is done by adding transport tls section to the input plugin @type prometheus within the provided configuration files.
<source>
  @type prometheus
  <transport tls>
    # TLS parameters...
  </transport
</source>
The following example sets up the Metrics Interface on HTTPS.
<transport tls>
  cert_path /path/to/jfrog.crt
  private_key_path /path/to/jfrog.key
  private_key_passphrase pass
</transport>
For client verification (Prometheus or ServiceMonitor as the client), you can also configure the Metrics Interface to validate using the client_cert_auth parameter.
<transport tls>
  cert_path /path/to/jfrog.crt
  private_key_path /path/to/jfrog.key
  private_key_passphrase pass
  client_cert_auth true
</transport>
For documentation on how to set up Prometheus for TLS using NGINX see here.
For testing purposes, you may want to expose Prometheus, Grafana and the FluentD Metrics interface. A test-only-expose.yaml provides an example of how to do this:
kubectl apply -f test-only-expose.yaml
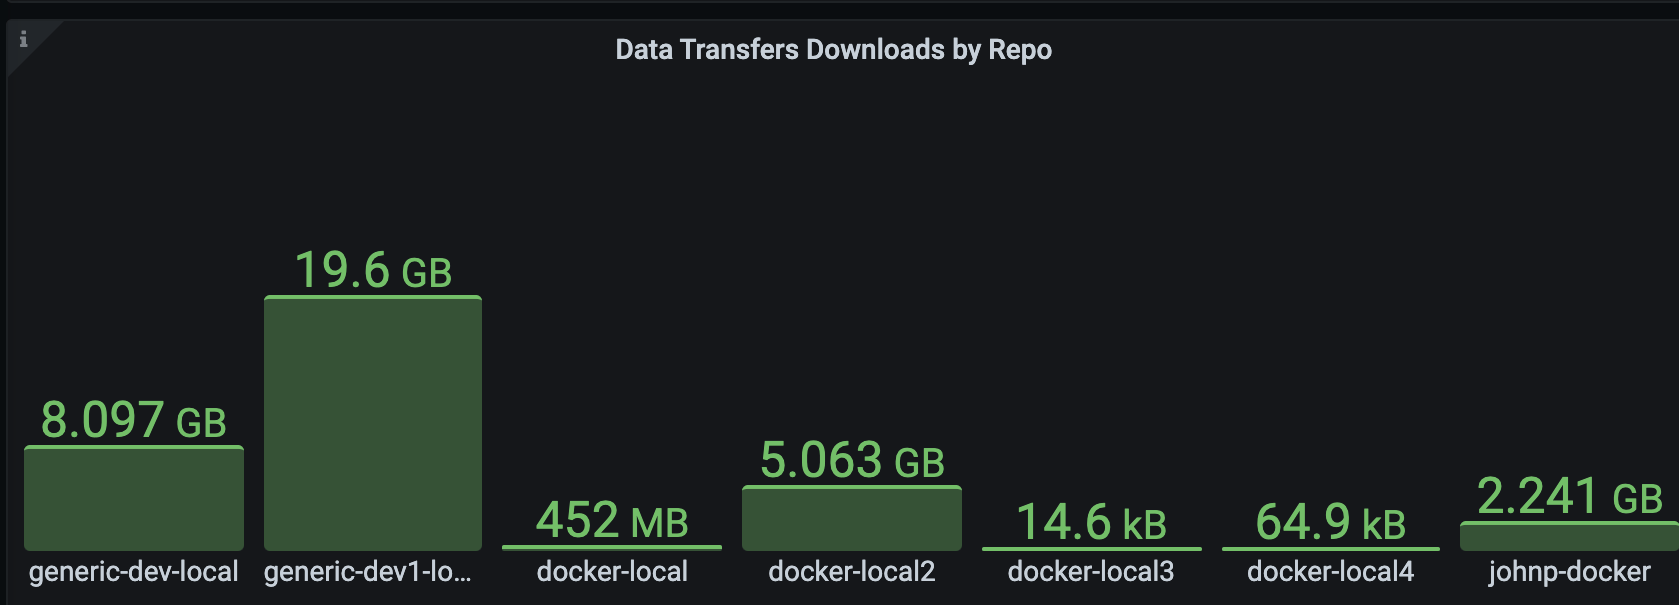
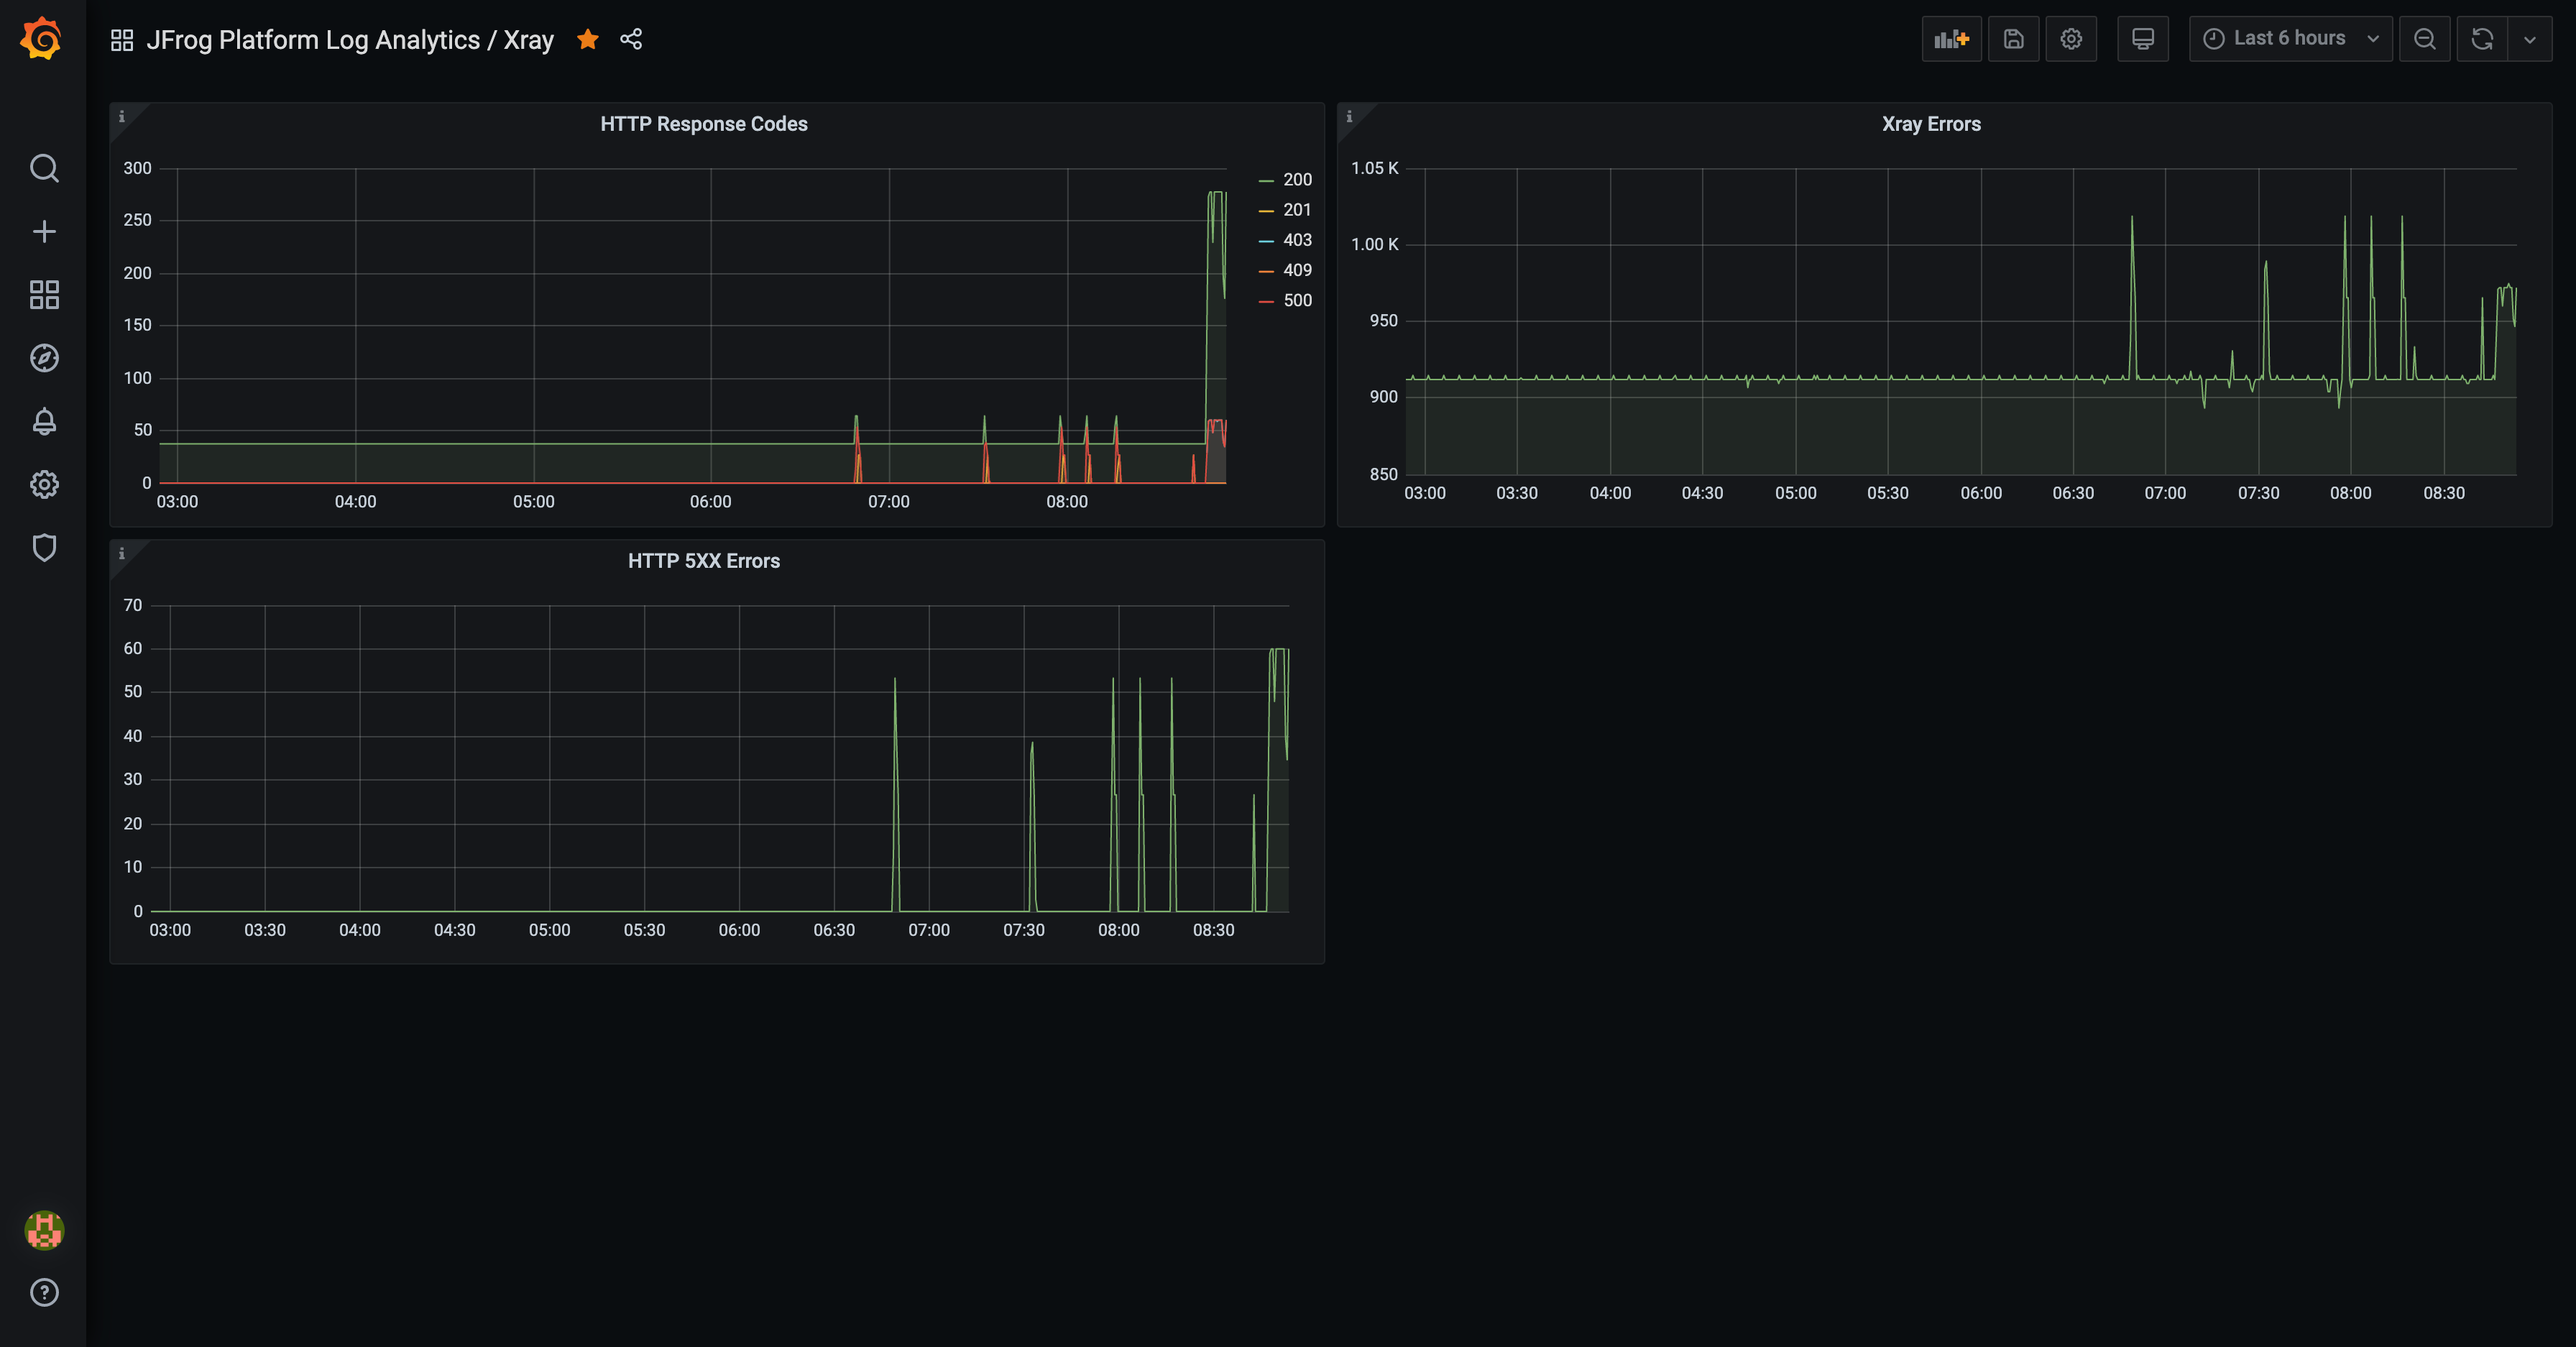
Example dashboards are included in the grafana directory. These include:
- Artifactory Dashboard
- Xray Dashboard
- Artifactory & Xray Drill Downs Dashboard (This dashboard supports the drill down features in the Artifactory and Xray dashboards.)
The following metrics are collected and can be queried using PromQL.
| Metric | Product | Type | Labels | Description |
|---|---|---|---|---|
| jfrog_rt_data_download | Artifactory | gauge | host, remote_address, repo, response_content_length, data_download | Data download in bytes. |
| jfrog_rt_data_upload | Artifactory | gauge | host, remote_address, repo, request_content_length, data_download | Data upload in bytes. |
| jfrog_rt_req | Artifactory | counter | host, remote_address, repo, artifact, request_url, return_status, dockerRepo, dockerImage | Requests to Artifactory. |
| jfrog_rt_log_level | Artifactory | counter | host, log_level | Logging level counter (ERROR, WARN, INFO, DEBUG). |
| jfrog_rt_service_message | Artifactory | counter | host, message | Service message and counts. |
| jfrog_rt_access | Artifactory | counter | host, username, action_response | Artifactory user access and response counter. |
| jfrog_rt_access_audit | Artifactory | counter | host, user, event_type, event | Artifactory user event counter. |
| jfrog_xray_req | Xray | counter | host, remote_address, request_url, return_status | Requests to Xray. |
| jfrog_xray_log_level | Xray | counter | host, log_level | Logging level counter (ERROR, WARN, INFO, DEBUG). |
Due to the nature of Prometheus pulling metrics a traditional fluentd ha setup with aggregator server is not supported. Artifactory & Xray HA setup is supported by installation of fluentd per node.


