- Pearson Correlation of ica_arima better than just arima
# %%

pearsonr(df_ret, df_ica_pred, alternative="greater"), \
    pearsonr(df_ret, df_arma_pred, alternative="greater")
(PearsonRResult(statistic=0.01340416190293595, pvalue=0.0630091125365575),
PearsonRResult(statistic=0.005678315103859606, pvalue=0.2584545828881826))
- Diebold Mariano test shows Directional Accuarcy (correct sign of returns predicted) for ica_arima significantly better than arima
#%%

print("Diebold Mariano test statistic, p-value:",
dm_test(
    np.sign(df_ret).values,
    np.sign(df_ica_pred).values,
    np.sign(df_arma_pred).values,
    loss=lambda a, b: abs(a - b),
    one_sided=True))
Diebold Mariano test statistic, p-value: (-1.1580454616279916, 0.12343335583198067)
- Diebold Mariano test shows Mean Absolute Error of ica_arima predicitons significantly better than arima
#%%

print("Diebold Mariano test statistic, p-value:",
dm_test(
    df_ret.values,
    df_ica_pred.values,
    df_arma_pred.values,
    loss=lambda a, b: abs(a - b),
    one_sided=True))
Diebold Mariano test statistic, p-value: (-10.756302880194324, 3.5880904215227915e-27)
- Diebold Mariano test shows Mean Squared Error of ica_arima predicitons significantly better than arima
#%%

print("Diebold Mariano test statistic, p-value:",
dm_test(
    df_ret.values,
    df_ica_pred.values,
    df_arma_pred.values,
    loss=lambda a, b: (a - b)**2,
    one_sided=True))
Diebold Mariano test statistic, p-value: (-6.523036238661388, 3.572181247611614e-11)
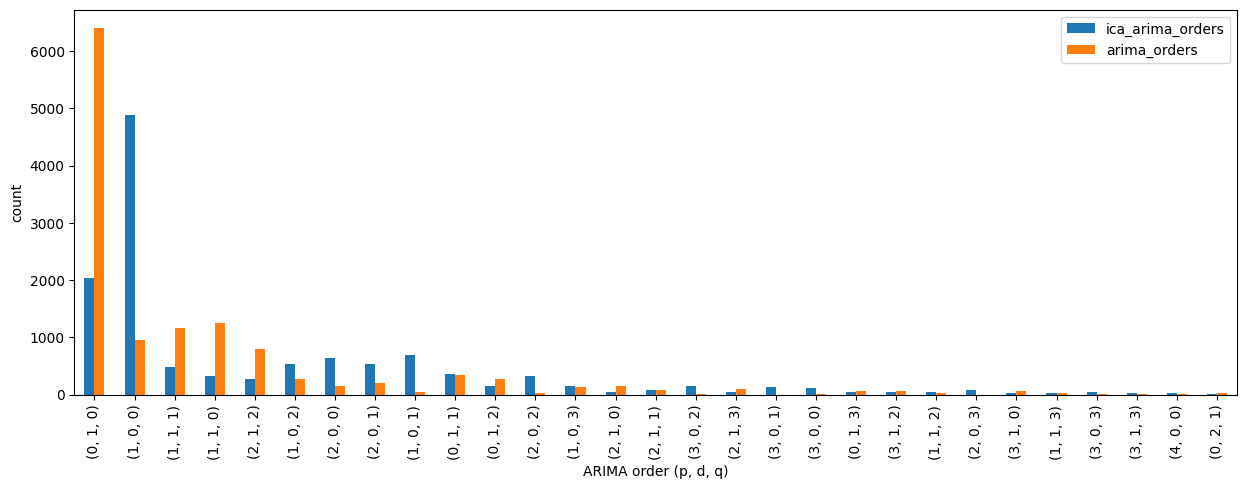
- for just ARIMA the AutoARIMA algorithm determined Brownian Noise with order (0, 1, 0) to be the best model of the process way more often than for ica + ARIMA, indicating application of ICA improved the Signal to Noise Ratio
#%%

n_train_days = 120
tick = "24h"
ica_orders = pd.read_csv(f"../data/ica_arma_orders_{tick}_{n_train_days}D.csv", index_col=0)
arima_orders = pd.read_csv(f"../data/arma_orders_{tick}_{n_train_days}D.csv", index_col=0)
orders = pd.concat((
    ica_orders.unstack().value_counts().rename("ica_arima_orders"),
    arima_orders.unstack().value_counts().rename("arima_orders")
    ), axis=1, join="inner")

orders.iloc[np.argsort(orders.sum(axis=1))[:-30:-1]].plot.bar(figsize=(15, 5))
plt.xlabel("ARIMA order (p, d, q)")
plt.ylabel("count")Oja, Erkki, Kimmo Kiviluoto, and Simona Malaroiu. "Independent component analysis for financial time series." Proceedings of the IEEE 2000 Adaptive Systems for Signal Processing, Communications, and Control Symposium (Cat. No. 00EX373). IEEE, 2000. doi.org/10.1109/ASSPCC.2000.882456
