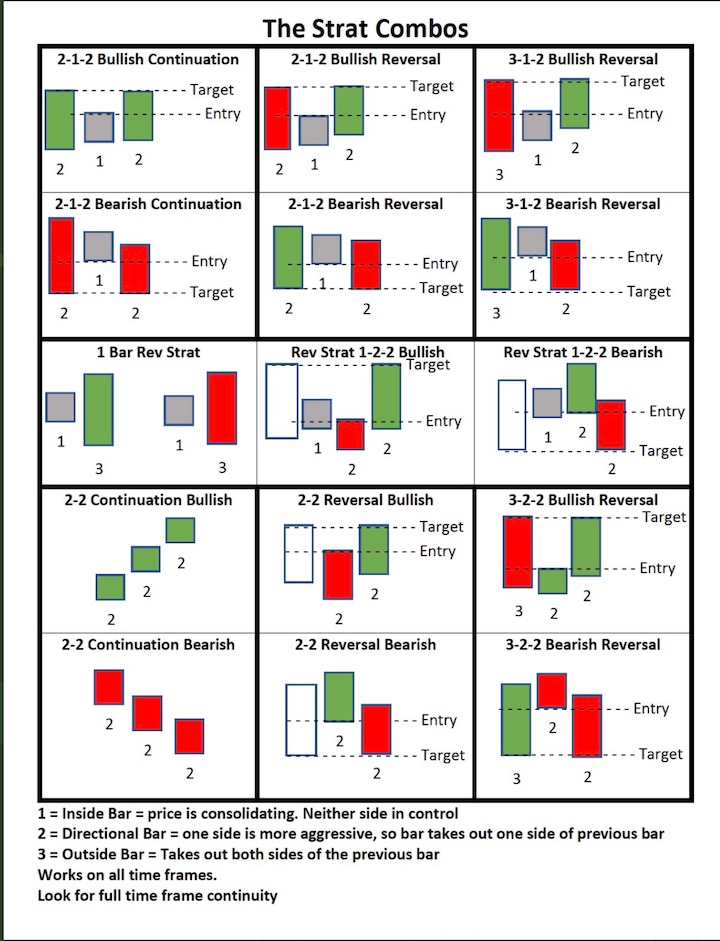
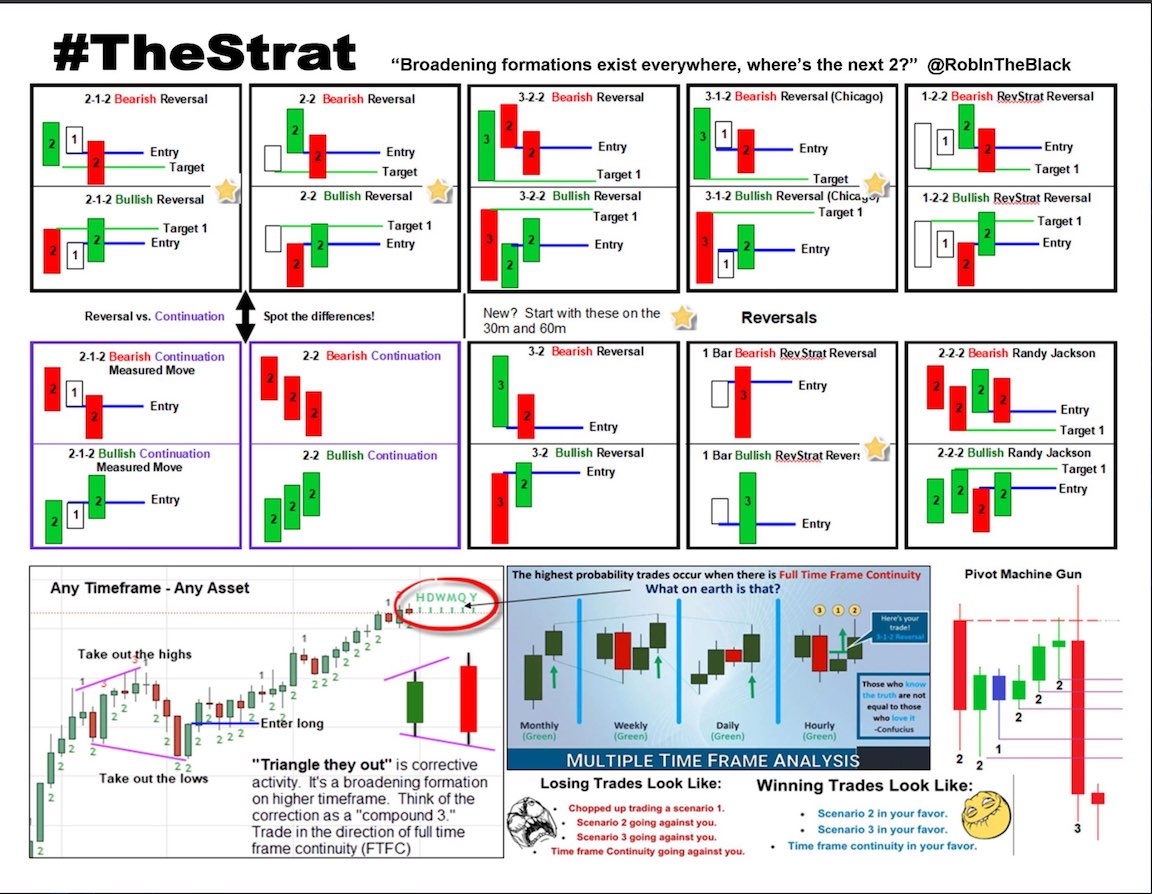
All things strat related for stock trading, a methodology created by Rob Smith. Knowledge should be collaborative and shared, not behind a paid wall. Definitely a work in progress. Not financial advice.
Want to contribute? Let me know ask for collaborator request. Twitter @rickyzane85
TheSTRAT is a trading method developed by Rob Smith (@RobInTheBlack).
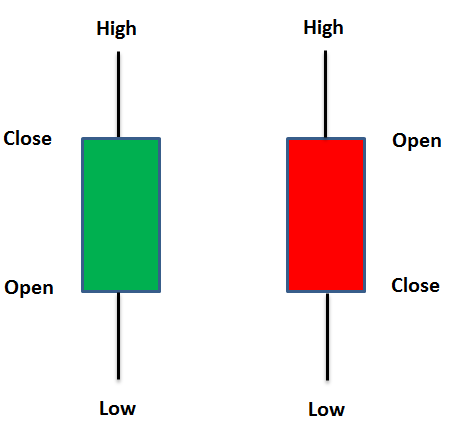
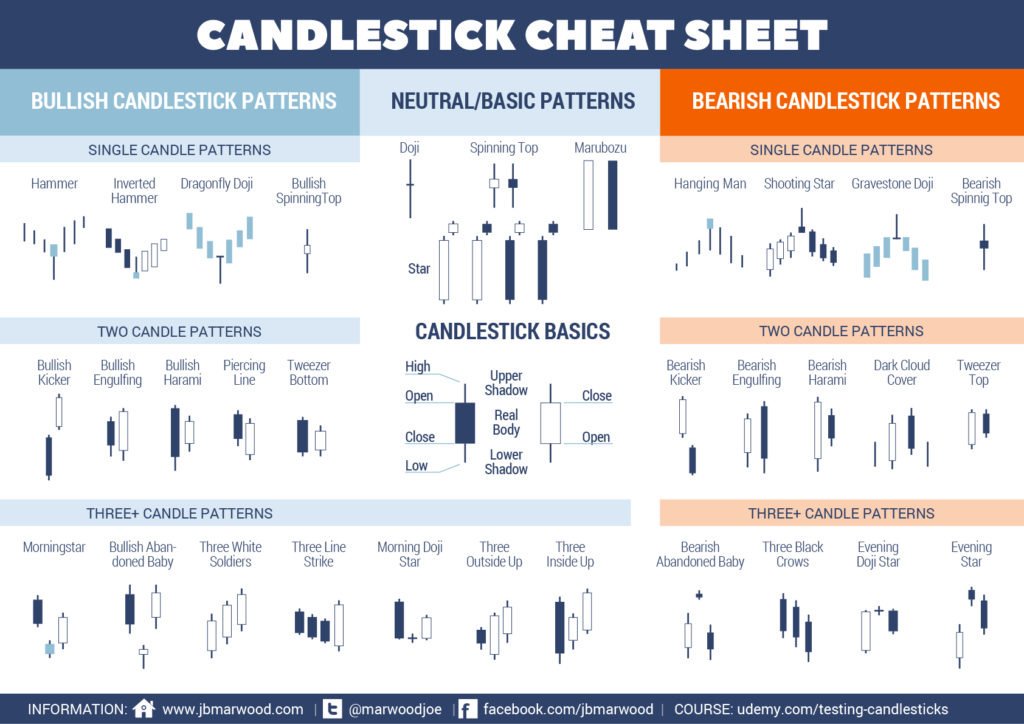
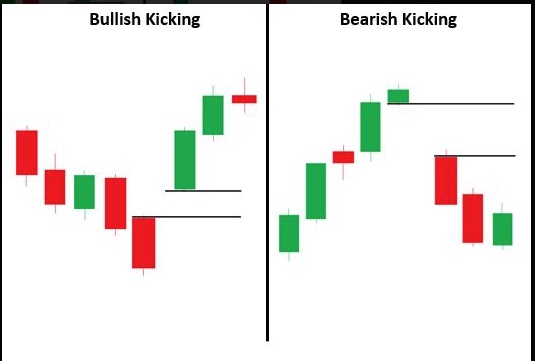
Before beginning you have to have a basic understanding of candlesticks. Candle sticks have 5 basic parts.
- WICKS
- 1 - Top wick / high / very top of the candle
- The highest price the stock trading during the given time frame of the candlestick
- 2 - Bottom wick / low / very bottom of the candle
- The lowest price the stock trading during the given time frame of the candlestick
- 1 - Top wick / high / very top of the candle
- FILL
- 3 - Open
- The price of the stock at the open of the given time frame (top or bottom of the fill depending on the color, more below)
- 4 - Close
- The price of the stock at the close of the given time frame (top or bottom of the fill depending on the color, more below)
- 5 - Color
- Green / Hollow / Empty
- 3/4 The open was lower than the close, it opened at the bottom and closed at the top (price went up)
- Red / Black / Full
- 3/4 The open was higher than the close, it opened at the bottom and closed at the top (price went down)
- Green / Hollow / Empty
- 3 - Open
- Example
- 1 Candle
- Names:
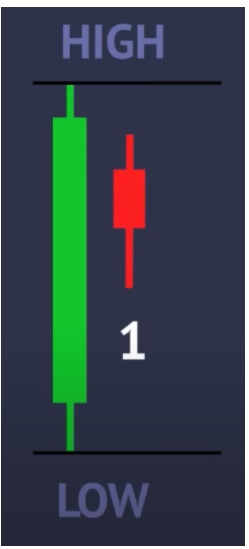
- 1 Candle / Inside Bar / Inside Action / Consolidation / Sideways
- Technical:
- Occur when the current candle falls completely within the prior candle
- Meaning:
- Balance, equilibrium, buyers and sellers agree on price, no one is in control, trying to determine where price is going next
- Detail:
- Never trade a one bar, wait for the consolidation to stop then it's time to get into a trade
- Example
- Names:
- 2 Candle
- Names:
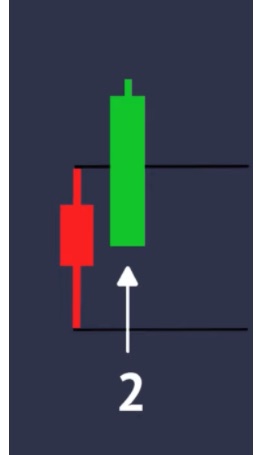
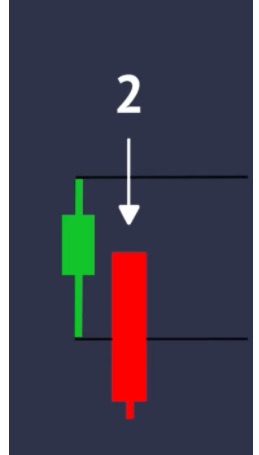
- 2 Candle / Directional Bar / 2 Down / 2 Up
- Technical:
- Occur when the current candle takes out one side of the prior candle
- A 2 down means it took out the previous candle's low, but failed to take out the high
- A 2 up means it took out the previous candle's high, but failed to take out the low
- Occur when the current candle takes out one side of the prior candle
- Meaning:
- Sellers are selling it down or buyers are buying it up but not both, a 2 can turn into a 3, but never a 1
- Action:
- The market trades in the direction of the most 2's, but only trade 2's with continuation
- Example:
- Names:
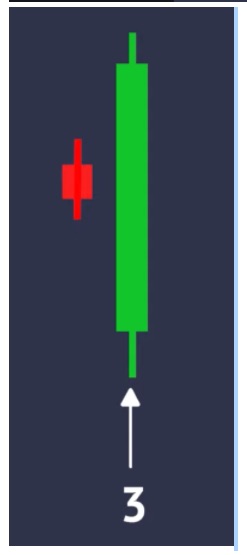
- 3 Candle
- Names:
- 3 Candle / Outside Bar / Discovery Candle / Mother Bar
- Technical:
- Occur when the current candle takes out both sides of the prior candle
- Meaning:
- Price discovery starting over, buyers willing to buy it up, sellers willing to buy it down, choppiness
- Action:
- Never trade a mother bar, price discovery is happening, wait for further confirmation one way or anther
- Example:
- Names:
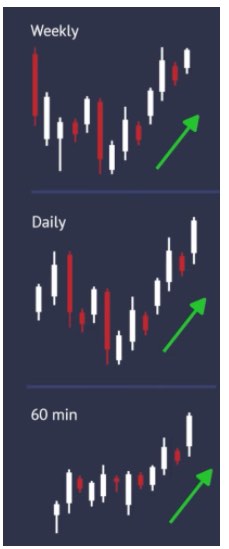
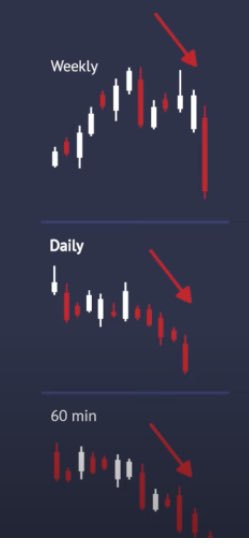
- Time Frame Continuity
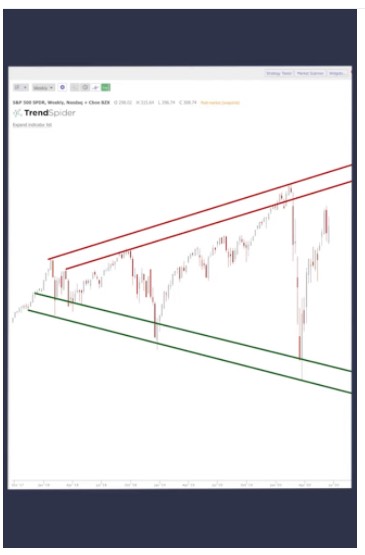
- Broadening Formations
- Simplest explanation is = it's a compound 3 bar
- Lower lows and higher highs
- Can draw this anywhere on any time line
- Just pick a high, draw the line to a higher high
- Pick a low, draw a line to a lower low
- Bars should be more FLAT than not, otherwise mostly inside action (which is fine, but if you are looking for trends start flatter)
- Increasing price volatility and diagrammed as two diverging trend lines, one rising and one falling
- It usually occurs after a significant rise, or fall, in pricing action
- It is identified on a chart by a series of higher pivot highs and lower pivot lows.
- Directional bars and outside bars that fit into a triangle and ultimately lead to reversals or expansions and present trading opportunities
- Picture:
- Simplest explanation is = it's a compound 3 bar
- Hammer
- Shooter / Shooting Star
- Candle that looks like a "shooter" / upside down hammer
- Little to no bottom wick, open and close are very close to the bottom of the wick, 75% of the candle is mostly wick at the top
- Action:
- Entry as soon as the next candle breaks below the bottom, or bottom wick, of the previous shooter candle
- Picture:
- Inside Bar
- Inside bar (explained above)
- Action:
- After price is done consolidating it will break up or down, take the break at the top or the bottom of the previous inside candle depending on which way it goes
- PMG - Pivot Machine Gun
- TTO - Triangle They Out
| TERM | MEANING | DESCRIPTION |
|---|---|---|
| 15'r/15er | 15 min Candle | Candle on 15 min interval |
| 5'r/5er | 5 min Candle | Candle on 5 min interval |
| 60'r/60er | 60 Min Candle | Candle on 60 min interval |
| AH | After Hours | Stock trading after the market closes 4PM EST |
| APTR | Average Percentage True Range | indicator to measure the volatility by percentage of a stock with price being neutral |
| AS | Actionable Signal | A "signal" to take an action |
| ATR | Average True Range | Volatility indicator - a wedge or triangle shape of the recent candles |
| BF | Broadening Formation | A compound 3 bar - higher highs - lower lows - subjectively drawn |
| BMO | Before Market Opens | Usually a term used for when earnings come out in the AM before the market opens |
| DTL | Down trend line (magic lines) | Trending down on the magic broadening formation trendline |
| EMA | Exponential moving Average | type of moving average that places a greater weight and significance on the most recent data points |
| EOD | End of Day | End of the stock trading day 4PM EST |
| EPS | Earnings Per Share | A company's earnings per share outstanding |
| ER | Exhaustion Risk | Reached magnitude or price target or right at broadening formation line |
| ETH | Extended trading hours | Trading that occures after the market close 4PM |
| FTC/FTFC | Full Time Frame Continuity | All time frames "match" - they are all up or down |
| GAP | A gap in stock price (missing candles | A stock opens and GAPS up or down and there is no fill in between. Missing by or sales may lead to opportunities for that gap to "fill" quickly when things reverse. |
| HAMMER | Candle that looks like a hammer or T | Actionable signal to a move upward |
| HCS | Hammer Counter Shooter | Hammer that counters/turns into a shooter |
| HOD | High of Day | The high stock price of the day |
| ID | Inside Day | Whole day is inside candle from prior day |
| IW | Inside Week | Whole week is inside candle from prior week |
| LOD | Low of Day | The low stock price of the day |
| MAG | Magnitude | How far a price run is or the price target |
| MM | Market Maker | Company or an individual that quotes both a buy and a sell price hoping to make a profit on the bid–ask spread |
| MOMO | Momentum | Usually momentum in a direction |
| MTFA | Multiple Time Frame Analysis | Look at more than one interval |
| MTG | Mind The Gap | Rob Smith saying look for the GAP on these it might fill |
| NATH | New All Time High | Stock made a new all time high |
| NHOD | New High of Day | A new high stock price of the day |
| NLOD | Low of Day | A new low stock price of the day |
| ORB | Opening Range Break | when a price breaks above or below the previous candle high or low from the open used on 15, 30, or 60 mins from open |
| ORH | Opening Range High | the high price of a stock from the opening range 15/40/60 mins from open breaking to the upside |
| ORL | Opening Range Low | the low price of a stock from the opening range 15/30/60 mins from open breaking to the downside |
| PDT | Pattern Day Trader | Traders who trade 4+ day trades over the span of 5 business days on a margin account get their account flagged with this |
| PM | PreMarket | Stock trading before the market opens 9:30AM EST |
| PMG | Pivot Machine Gun | Trend pivots the other way taking out several highs or lows of other candles |
| SHOOTER | Candle that looks like a gun or upside down T | Actionable signal to a move downward |
| SMA | Simple Moving Average | moving average calculated by adding recent prices and then dividing that figure by the number of time periods |
| The Flip | New candle | Flip of the time interval to produce a new candle |
| TTO | Triangle They Out | corrective pullback/activity - a wedge or triangle shape of the recent candles |
| VWAP | Volume Weighted Average Price | statistic used by traders to determine what the average price is based on both price and volume |
| WW | Worth Watching | Keep an eye on a this stock |
| IN FORCE | A method/strategy is in force | Above the reversal / continuation entry to the upside and below the reversal / continuation entry to the downside |
| LOTTO | Lottery Ticket | Gamble play, risky but very rewarding, usually a fast expiry |
- https://www.youtube.com/user/smithsintheblack
- https://www.youtube.com/user/ssabatino84
- https://www.youtube.com/channel/UCYllJ4eRU4wDVSbZ9pHIJKA
- @RobInTheBlack is the creator
- @LevJampolsky
- @AlexsOptions
- @TradeSniperSara
- @CyberDog2
- @jam_trades
- @JamesBradley_
- @japor3
- @WayoftheMaster7
- @ADBYNOT
- @chucknfones
- @OptionizerSS
- @r3dpepsi
- @Banker_L83
- @R2DayTrades
- @FranknBear
- @StratDevilDog
- @yogajen70
- @toddjostendorf
- @ElaineBenes99
- CNBC - premarket
- Fed Reserve Calendar & Events
- Economic Calendar
- Upcoming Earnings
- Blog
- Newsletter
- Marketwatch: upgrades & downgrades
- Analyst Consensus
- Short Interest
- Finviz Sector Tool
- TD Ameritrade Think of Swim Scripts
- Trading View Scripts
- Just search for The Strat
- My personal script for free - actionable signals, colors, strategies, work in progress
- Others
- Good explanation of TheStrat
- StratFlix - great list of strat videos
- Tons of free books
- Options Calculator
- Charting
- Automating Trades
- Market / Timeframe Alerts
- TD Ameritrade
- E-Trade
- Webull
- Interactive Brokers
- Robinhood
