


Flagger is a Kubernetes operator that automates the promotion of canary deployments using Istio routing for traffic shifting and Prometheus metrics for canary analysis.
Before installing Flagger make sure you have Istio setup up with Prometheus enabled. If you are new to Istio you can follow my Istio service mesh walk-through.
Deploy Flagger in the istio-system namespace using Helm:
# add the Helm repository
helm repo add flagger https://flagger.app

# install or upgrade
helm upgrade -i flagger flagger/flagger \
--namespace=istio-system \
--set metricsServer=http://prometheus.istio-system:9090 \
--set controlLoopInterval=1m
Flagger is compatible with Kubernetes >1.10.0 and Istio >1.0.0.
Flagger takes a Kubernetes deployment and creates a series of objects (Kubernetes deployments, ClusterIP services and Istio virtual services) to drive the canary analysis and promotion.
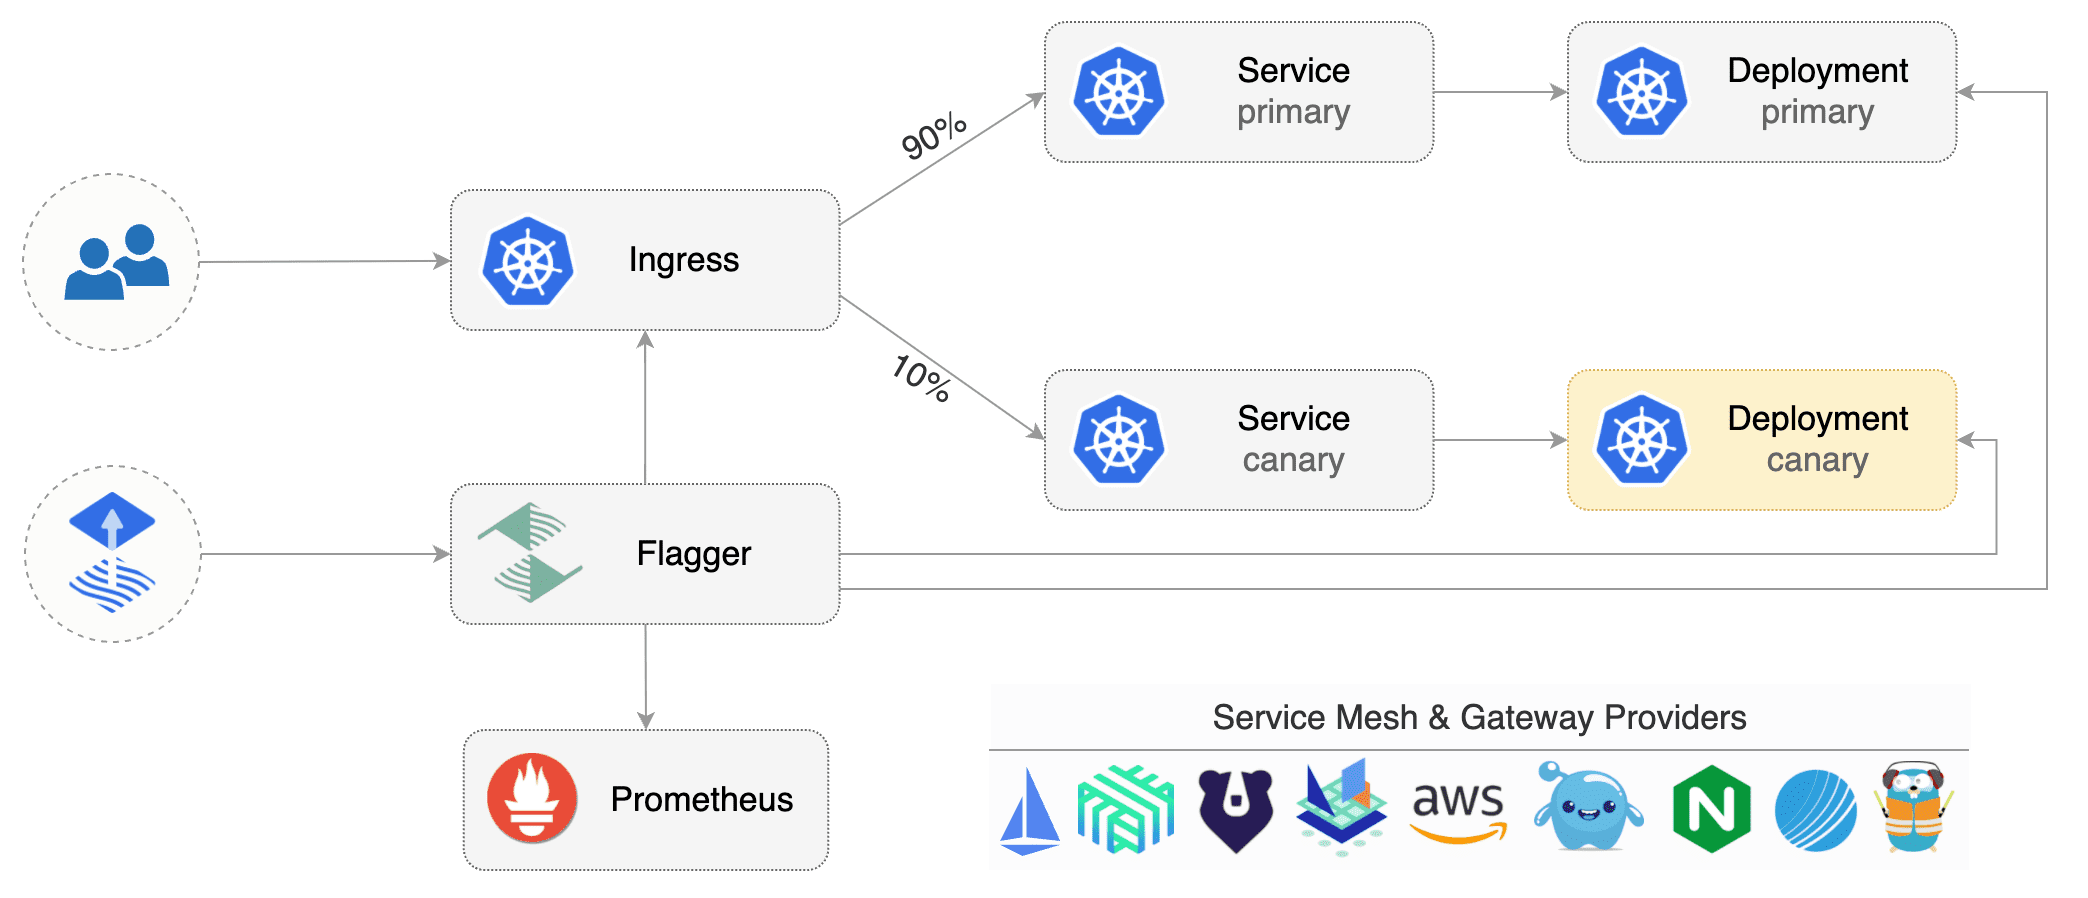
Gated canary promotion stages:
- scan for canary deployments
- check Istio virtual service routes are mapped to primary and canary ClusterIP services
- check primary and canary deployments status
- halt advancement if a rolling update is underway
- halt advancement if pods are unhealthy
- increase canary traffic weight percentage from 0% to 5% (step weight)
- check canary HTTP request success rate and latency
- halt advancement if any metric is under the specified threshold
- increment the failed checks counter
- check if the number of failed checks reached the threshold
- route all traffic to primary
- scale to zero the canary deployment and mark it as failed
- wait for the canary deployment to be updated (revision bump) and start over
- increase canary traffic weight by 5% (step weight) till it reaches 50% (max weight)
- halt advancement while canary request success rate is under the threshold
- halt advancement while canary request duration P99 is over the threshold
- halt advancement if the primary or canary deployment becomes unhealthy
- halt advancement while canary deployment is being scaled up/down by HPA
- promote canary to primary
- copy canary deployment spec template over primary
- wait for primary rolling update to finish
- halt advancement if pods are unhealthy
- route all traffic to primary
- scale to zero the canary deployment
- mark rollout as finished
- wait for the canary deployment to be updated (revision bump) and start over
You can change the canary analysis max weight and the step weight percentage in the Flagger's custom resource.
For a deployment named podinfo, a canary promotion can be defined using Flagger's custom resource:
apiVersion: flagger.app/v1alpha1
kind: Canary
metadata:
  name: podinfo
  namespace: test
spec:
  # deployment reference
  targetRef:
    apiVersion: apps/v1
    kind: Deployment
    name: podinfo
  # the maximum time in seconds for the canary deployment
  # to make progress before it is rollback (default 600s)
  progressDeadlineSeconds: 60
  # hpa reference (optional)
  autoscalerRef:
    apiVersion: autoscaling/v2beta1
    kind: HorizontalPodAutoscaler
    name: podinfo
  service:
    # container port
    port: 9898
    # Istio gateways (optional)
    gateways:
    - public-gateway.istio-system.svc.cluster.local
    # Istio virtual service host names (optional)
    hosts:
    - app.istio.weavedx.com
  canaryAnalysis:
    # max number of failed metric checks before rollback
    threshold: 5
    # max traffic percentage routed to canary
    # percentage (0-100)
    maxWeight: 50
    # canary increment step
    # percentage (0-100)
    stepWeight: 10
    metrics:
    - name: istio_requests_total
      # minimum req success rate (non 5xx responses)
      # percentage (0-100)
      threshold: 99
      interval: 1m
    - name: istio_request_duration_seconds_bucket
      # maximum req duration P99
      # milliseconds
      threshold: 500
      interval: 30s
The canary analysis is using the following promql queries:
HTTP requests success rate percentage
sum(
    rate(
        istio_requests_total{
          reporter="destination",
          destination_workload_namespace=~"$namespace",
          destination_workload=~"$workload",
          response_code!~"5.*"
        }[$interval]
    )
)
/
sum(
    rate(
        istio_requests_total{
          reporter="destination",
          destination_workload_namespace=~"$namespace",
          destination_workload=~"$workload"
        }[$interval]
    )
)
HTTP requests milliseconds duration P99
histogram_quantile(0.99,
  sum(
    irate(
      istio_request_duration_seconds_bucket{
        reporter="destination",
        destination_workload=~"$workload",
        destination_workload_namespace=~"$namespace"
      }[$interval]
    )
  ) by (le)
)Create a test namespace with Istio sidecar injection enabled:
export REPO=https://raw.githubusercontent.com/stefanprodan/flagger/master

kubectl apply -f ${REPO}/artifacts/namespaces/test.yaml
Create a deployment and a horizontal pod autoscaler:
kubectl apply -f ${REPO}/artifacts/canaries/deployment.yaml
kubectl apply -f ${REPO}/artifacts/canaries/hpa.yaml
Create a canary promotion custom resource (replace the Istio gateway and the internet domain with your own):
kubectl apply -f ${REPO}/artifacts/canaries/canary.yamlAfter a couple of seconds Flagger will create the canary objects:
# applied
deployment.apps/podinfo
horizontalpodautoscaler.autoscaling/podinfo
canary.flagger.app/podinfo
# generated
deployment.apps/podinfo-primary
horizontalpodautoscaler.autoscaling/podinfo-primary
service/podinfo
service/podinfo-canary
service/podinfo-primary
virtualservice.networking.istio.io/podinfo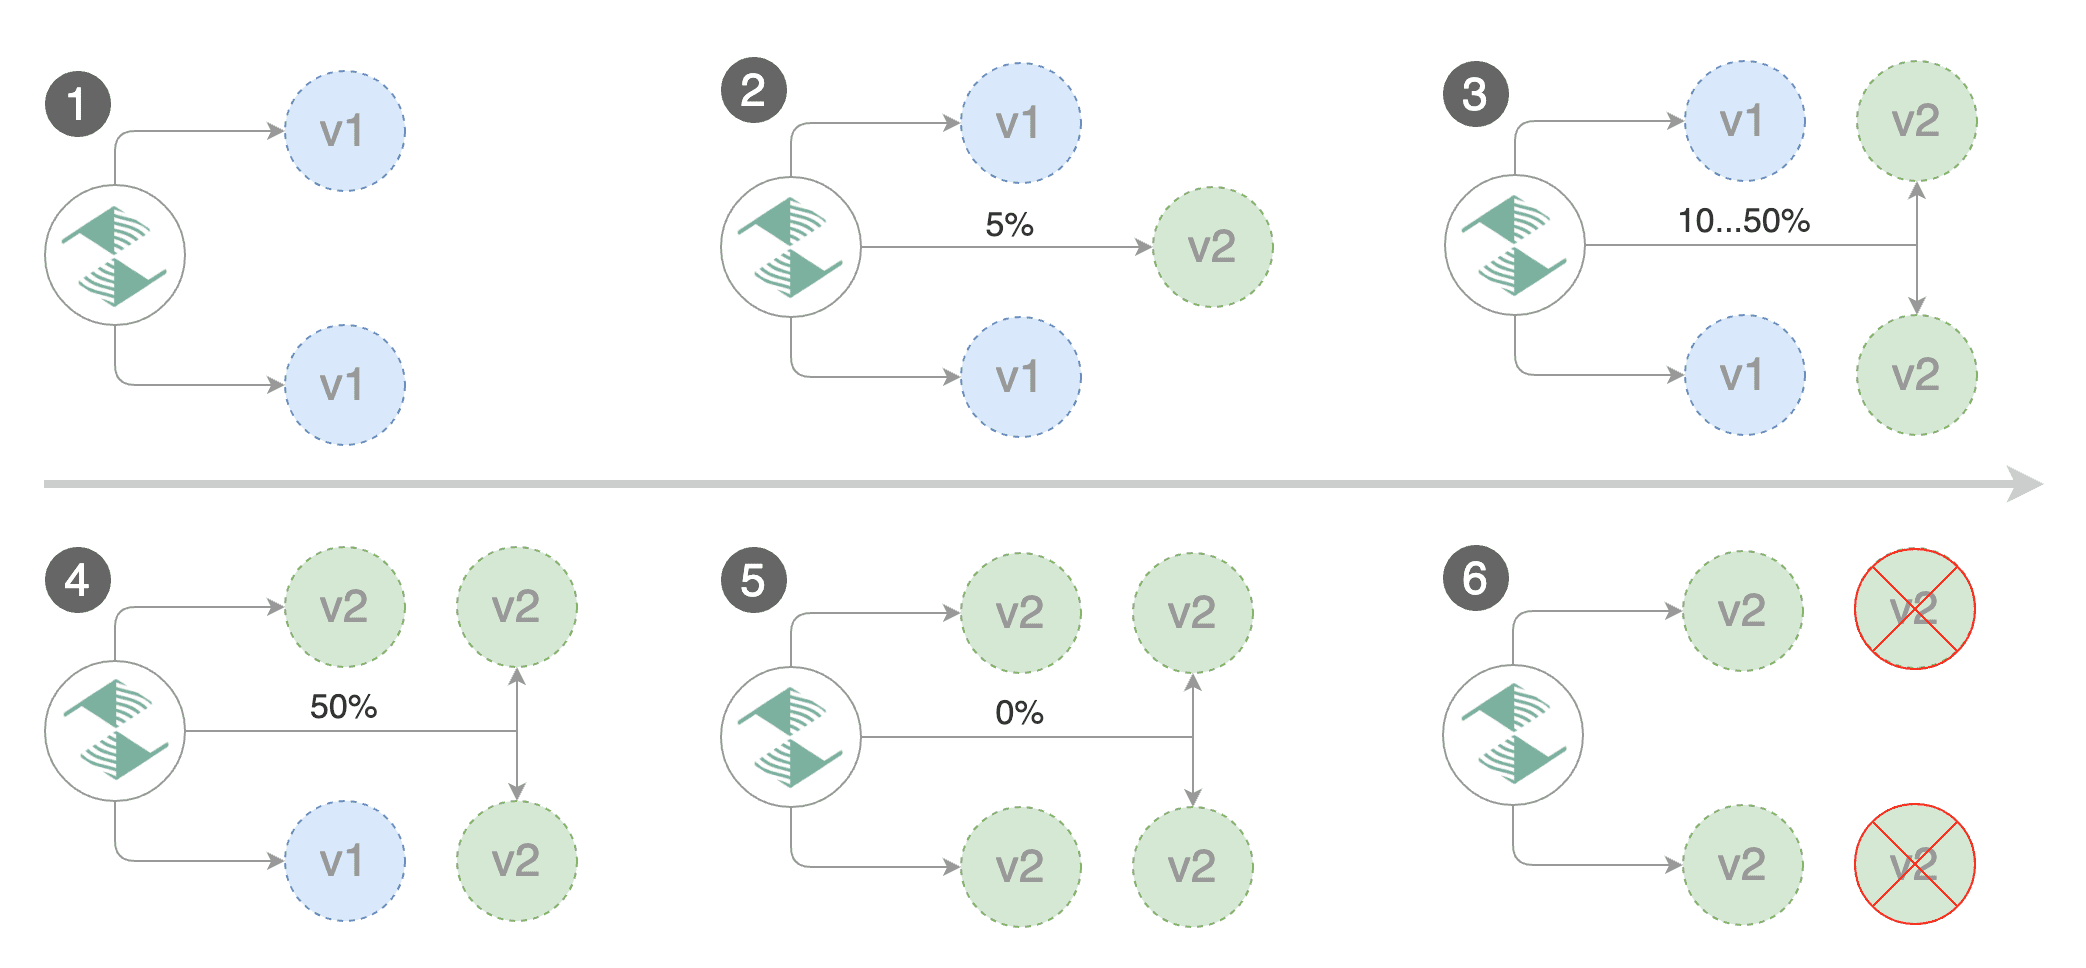
Trigger a canary deployment by updating the container image:
kubectl -n test set image deployment/podinfo \
podinfod=quay.io/stefanprodan/podinfo:1.2.1
Flagger detects that the deployment revision changed and starts a new rollout:
kubectl -n test describe canary/podinfo

Status:
  Canary Revision:  19871136
  Failed Checks:    0
  State:            finished
Events:
  Type     Reason  Age   From     Message
  ----     ------  ----  ----     -------
  Normal   Synced  3m    flagger  New revision detected podinfo.test
  Normal   Synced  3m    flagger  Scaling up podinfo.test
  Warning  Synced  3m    flagger  Waiting for podinfo.test rollout to finish: 0 of 1 updated replicas are available
  Normal   Synced  3m    flagger  Advance podinfo.test canary weight 5
  Normal   Synced  3m    flagger  Advance podinfo.test canary weight 10
  Normal   Synced  3m    flagger  Advance podinfo.test canary weight 15
  Normal   Synced  2m    flagger  Advance podinfo.test canary weight 20
  Normal   Synced  2m    flagger  Advance podinfo.test canary weight 25
  Normal   Synced  1m    flagger  Advance podinfo.test canary weight 30
  Normal   Synced  1m    flagger  Advance podinfo.test canary weight 35
  Normal   Synced  55s   flagger  Advance podinfo.test canary weight 40
  Normal   Synced  45s   flagger  Advance podinfo.test canary weight 45
  Normal   Synced  35s   flagger  Advance podinfo.test canary weight 50
  Normal   Synced  25s   flagger  Copying podinfo.test template spec to podinfo-primary.test
  Warning  Synced  15s   flagger  Waiting for podinfo-primary.test rollout to finish: 1 of 2 updated replicas are available
  Normal   Synced  5s    flagger  Promotion completed! Scaling down podinfo.test
During the canary analysis you can generate HTTP 500 errors and high latency to test if Flagger pauses the rollout.
Create a tester pod and exec into it:
kubectl -n test run tester --image=quay.io/stefanprodan/podinfo:1.2.1 -- ./podinfo --port=9898
kubectl -n test exec -it tester-xx-xx sh
Generate HTTP 500 errors:
watch curl http://podinfo-canary:9898/status/500Generate latency:
watch curl http://podinfo-canary:9898/delay/1When the number of failed checks reaches the canary analysis threshold, the traffic is routed back to the primary, the canary is scaled to zero and the rollout is marked as failed.
kubectl -n test describe canary/podinfo

Status:
  Canary Revision:  16695041
  Failed Checks:    10
  State:            failed
Events:
  Type     Reason  Age   From     Message
  ----     ------  ----  ----     -------
  Normal   Synced  3m    flagger  Starting canary deployment for podinfo.test
  Normal   Synced  3m    flagger  Advance podinfo.test canary weight 5
  Normal   Synced  3m    flagger  Advance podinfo.test canary weight 10
  Normal   Synced  3m    flagger  Advance podinfo.test canary weight 15
  Normal   Synced  3m    flagger  Halt podinfo.test advancement success rate 69.17% < 99%
  Normal   Synced  2m    flagger  Halt podinfo.test advancement success rate 61.39% < 99%
  Normal   Synced  2m    flagger  Halt podinfo.test advancement success rate 55.06% < 99%
  Normal   Synced  2m    flagger  Halt podinfo.test advancement success rate 47.00% < 99%
  Normal   Synced  2m    flagger  (combined from similar events): Halt podinfo.test advancement success rate 38.08% < 99%
  Warning  Synced  1m    flagger  Rolling back podinfo.test failed checks threshold reached 10
  Warning  Synced  1m    flagger  Canary failed! Scaling down podinfo.test
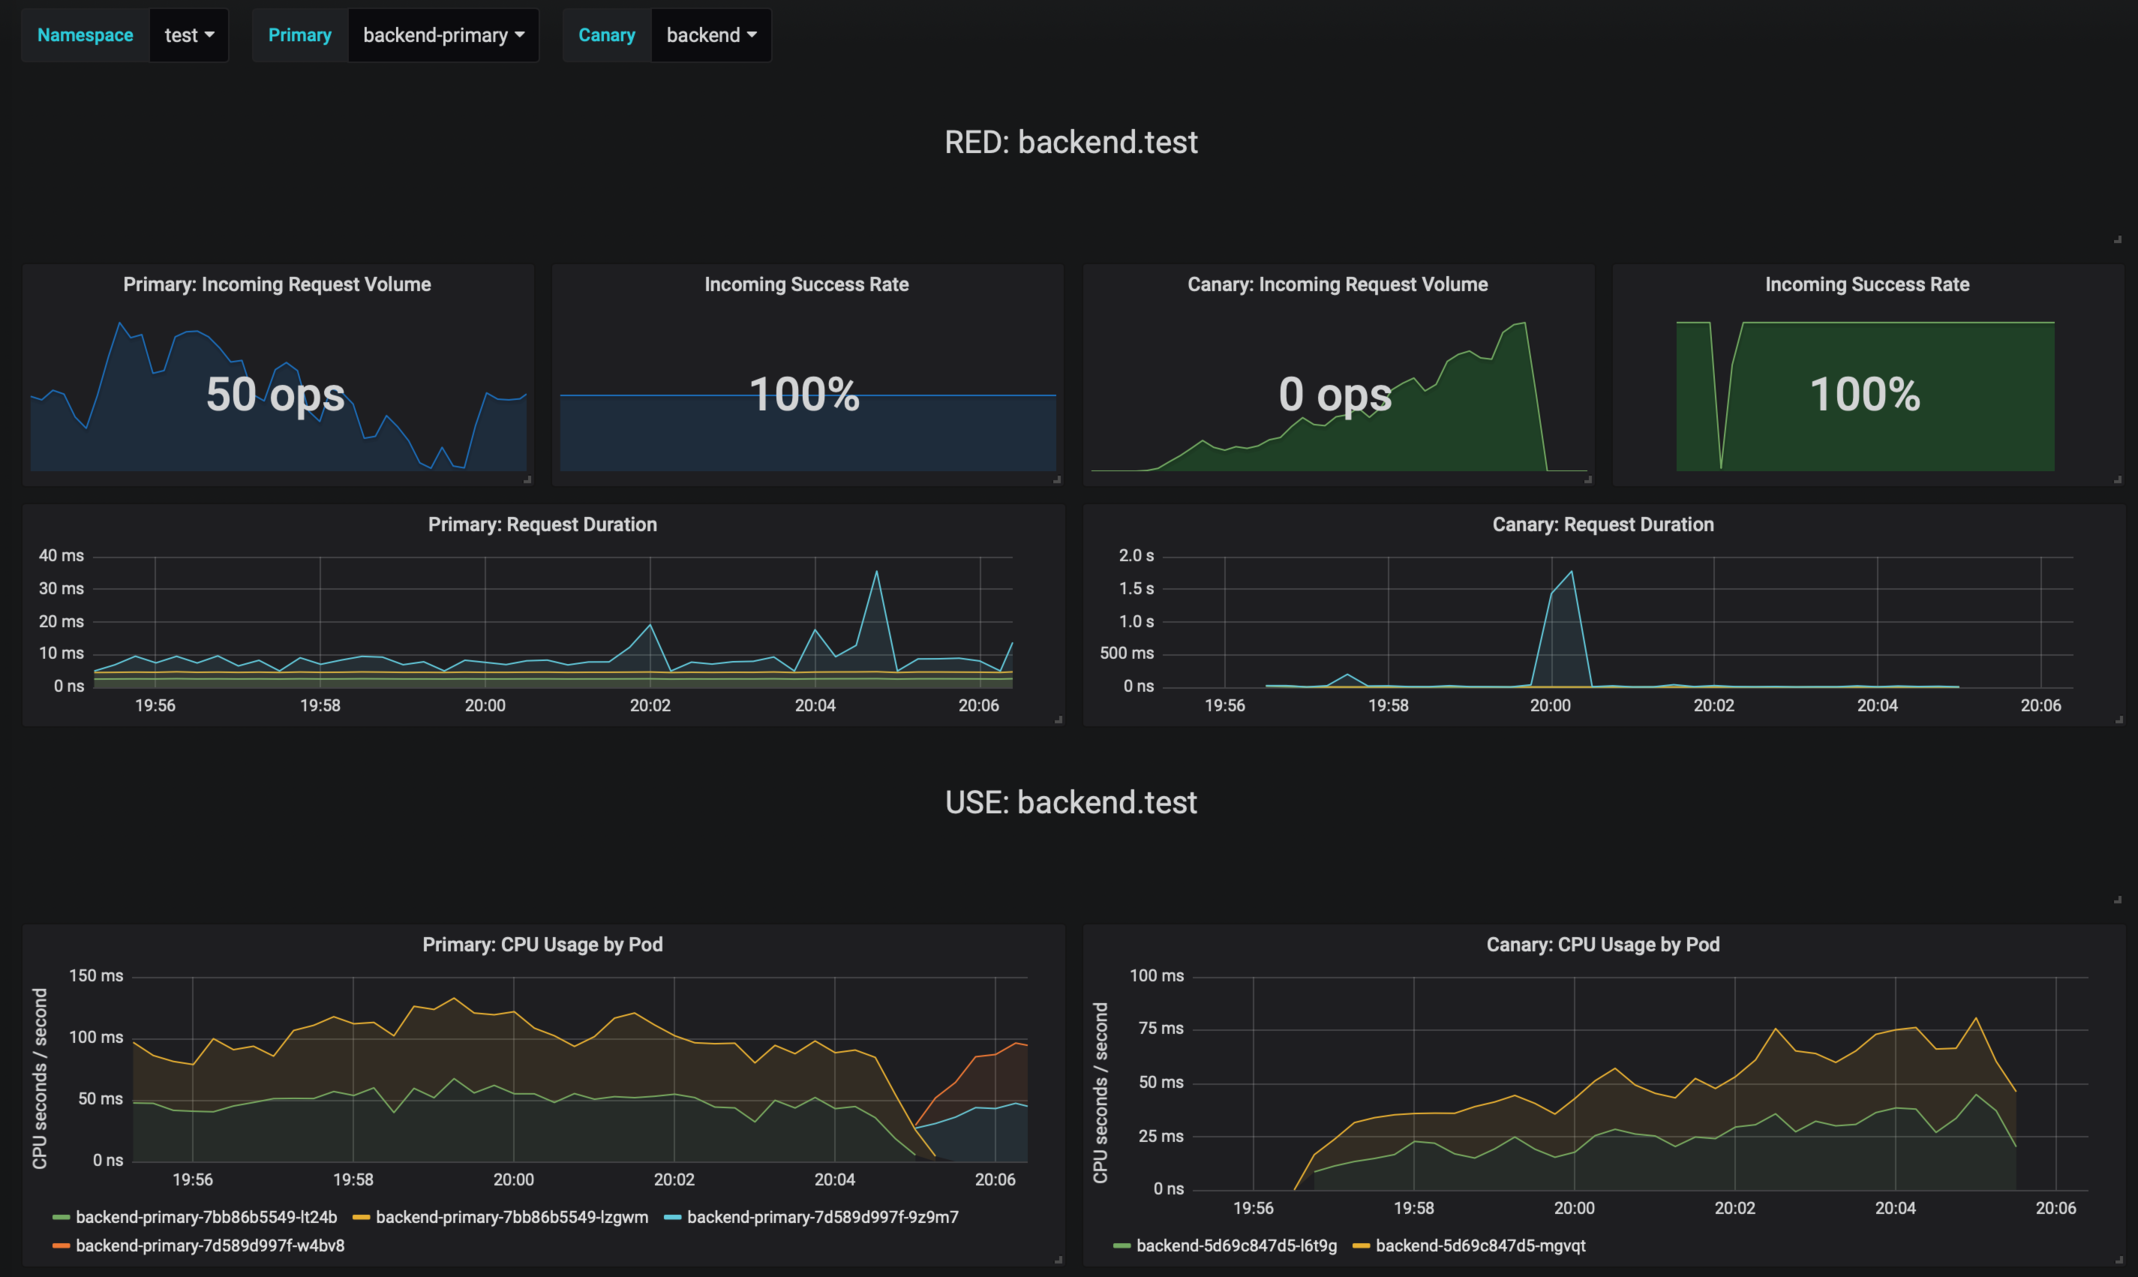
Flagger comes with a Grafana dashboard made for canary analysis.
Install Grafana with Helm:
helm upgrade -i flagger-grafana flagger/grafana \
--namespace=istio-system \
--set url=http://prometheus.istio-system:9090
The dashboard shows the RED and USE metrics for the primary and canary workloads:
The canary errors and latency spikes have been recorded as Kubernetes events and logged by Flagger in json format:
kubectl -n istio-system logs deployment/flagger --tail=100 | jq .msg

Starting canary deployment for podinfo.test
Advance podinfo.test canary weight 5
Advance podinfo.test canary weight 10
Advance podinfo.test canary weight 15
Advance podinfo.test canary weight 20
Advance podinfo.test canary weight 25
Advance podinfo.test canary weight 30
Advance podinfo.test canary weight 35
Halt podinfo.test advancement success rate 98.69% < 99%
Advance podinfo.test canary weight 40
Halt podinfo.test advancement request duration 1.515s > 500ms
Advance podinfo.test canary weight 45
Advance podinfo.test canary weight 50
Copying podinfo.test template spec to podinfo-primary.test
Halt podinfo-primary.test advancement waiting for rollout to finish: 1 old replicas are pending termination
Scaling down podinfo.test
Promotion completed! podinfo.test
Flagger exposes Prometheus metrics that can be used to determine the canary analysis status and the destination weight values:
# Canaries total gauge
flagger_canary_total{namespace="test"} 1

# Canary promotion last known status gauge
# 0 - running, 1 - successful, 2 - failed
flagger_canary_status{name="podinfo" namespace="test"} 1

# Canary traffic weight gauge
flagger_canary_weight{workload="podinfo-primary" namespace="test"} 95
flagger_canary_weight{workload="podinfo" namespace="test"} 5

# Seconds spent performing canary analysis histogram
flagger_canary_duration_seconds_bucket{name="podinfo",namespace="test",le="10"} 6
flagger_canary_duration_seconds_bucket{name="podinfo",namespace="test",le="+Inf"} 6
flagger_canary_duration_seconds_sum{name="podinfo",namespace="test"} 17.3561329
flagger_canary_duration_seconds_count{name="podinfo",namespace="test"} 6Flagger can be configured to send Slack notifications:
helm upgrade -i flagger flagger/flagger \
--namespace=istio-system \
--set slack.url=https://hooks.slack.com/services/YOUR/SLACK/WEBHOOK \
--set slack.channel=general \
--set slack.user=flagger
Once configured with a Slack incoming webhook, Flagger will post messages when a canary deployment has been initialized, when a new revision has been detected and if the canary analysis failed or succeeded.

- Extend the validation mechanism to support other metrics than HTTP success rate and latency
- Add support for comparing the canary metrics to the primary ones and do the validation based on the derivation between the two
- Extend the canary analysis and promotion to other types than Kubernetes deployments such as Flux Helm releases or OpenFaaS functions
Flagger is Apache 2.0 licensed and accepts contributions via GitHub pull requests.
When submitting bug reports please include as much details as possible:
- which Flagger version
- which Flagger CRD version
- which Kubernetes/Istio version
- what configuration (canary, virtual service and workloads definitions)
- what happened (Flagger, Istio Pilot and Proxy logs)