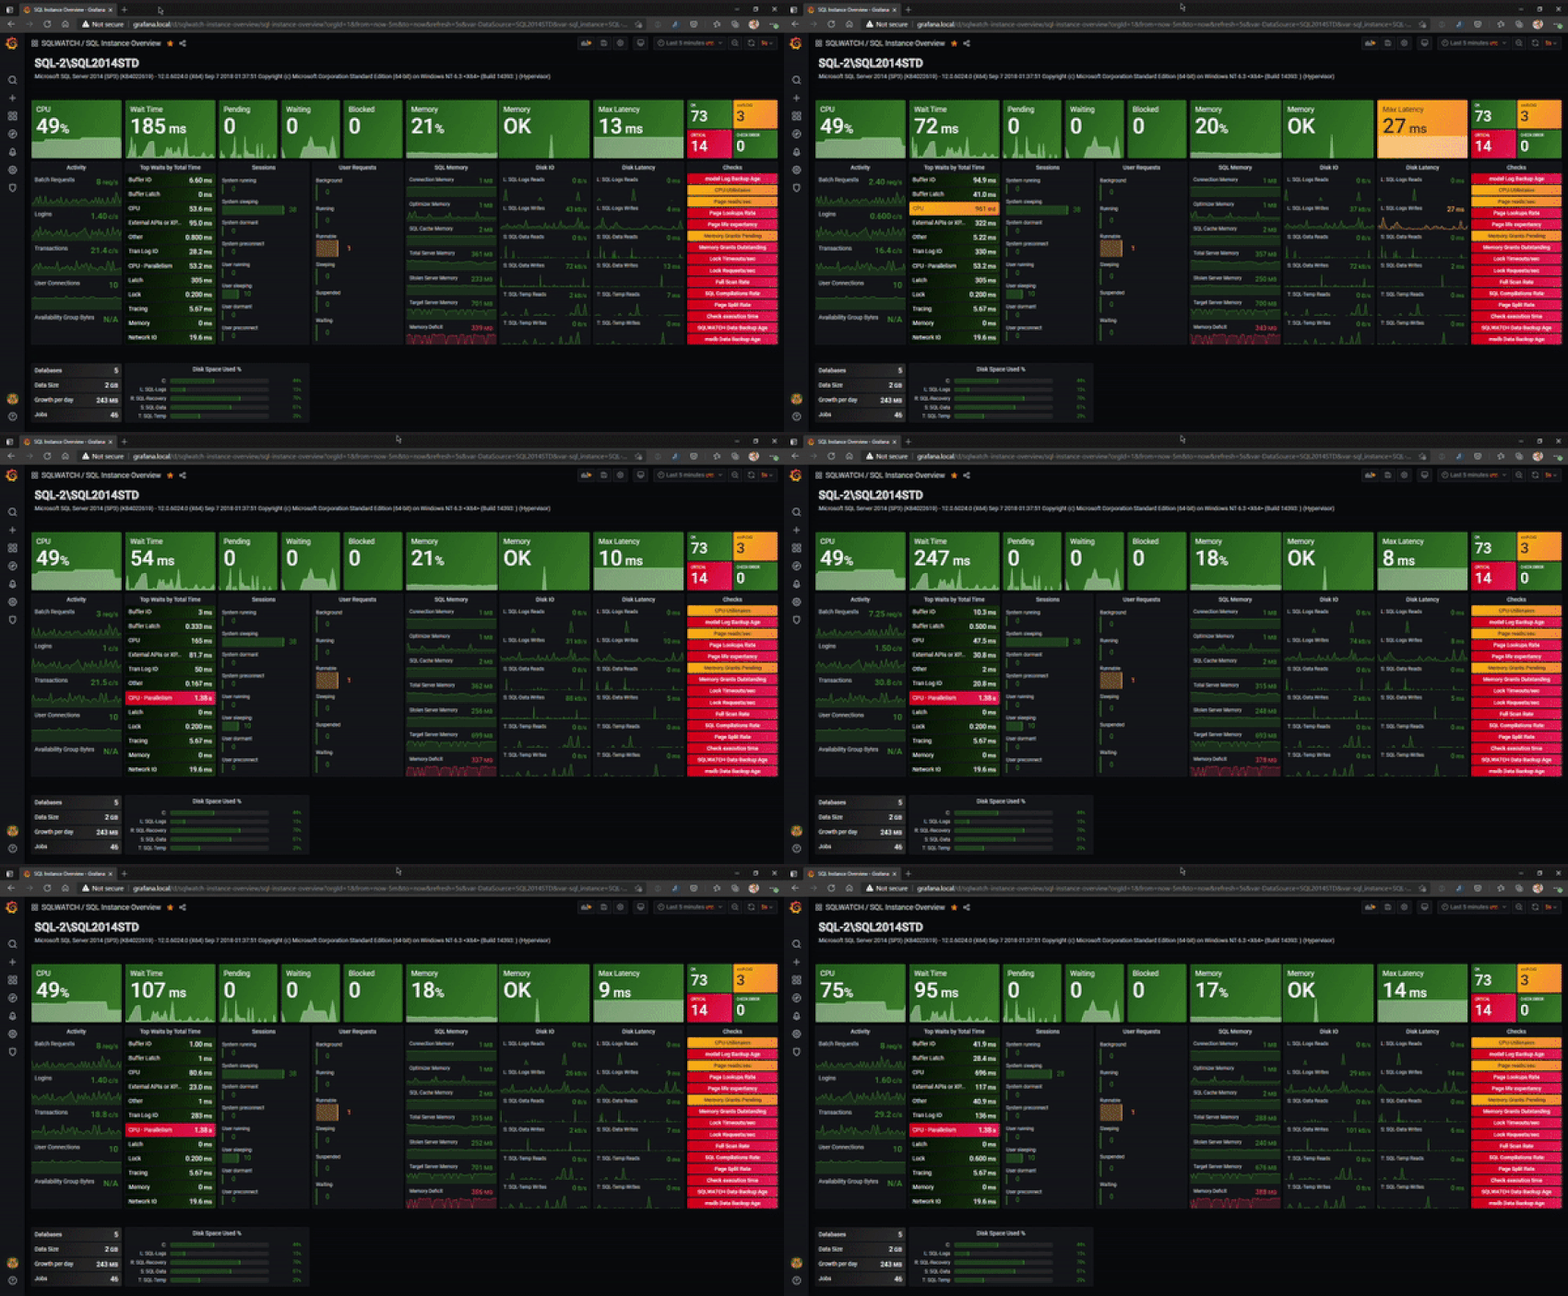
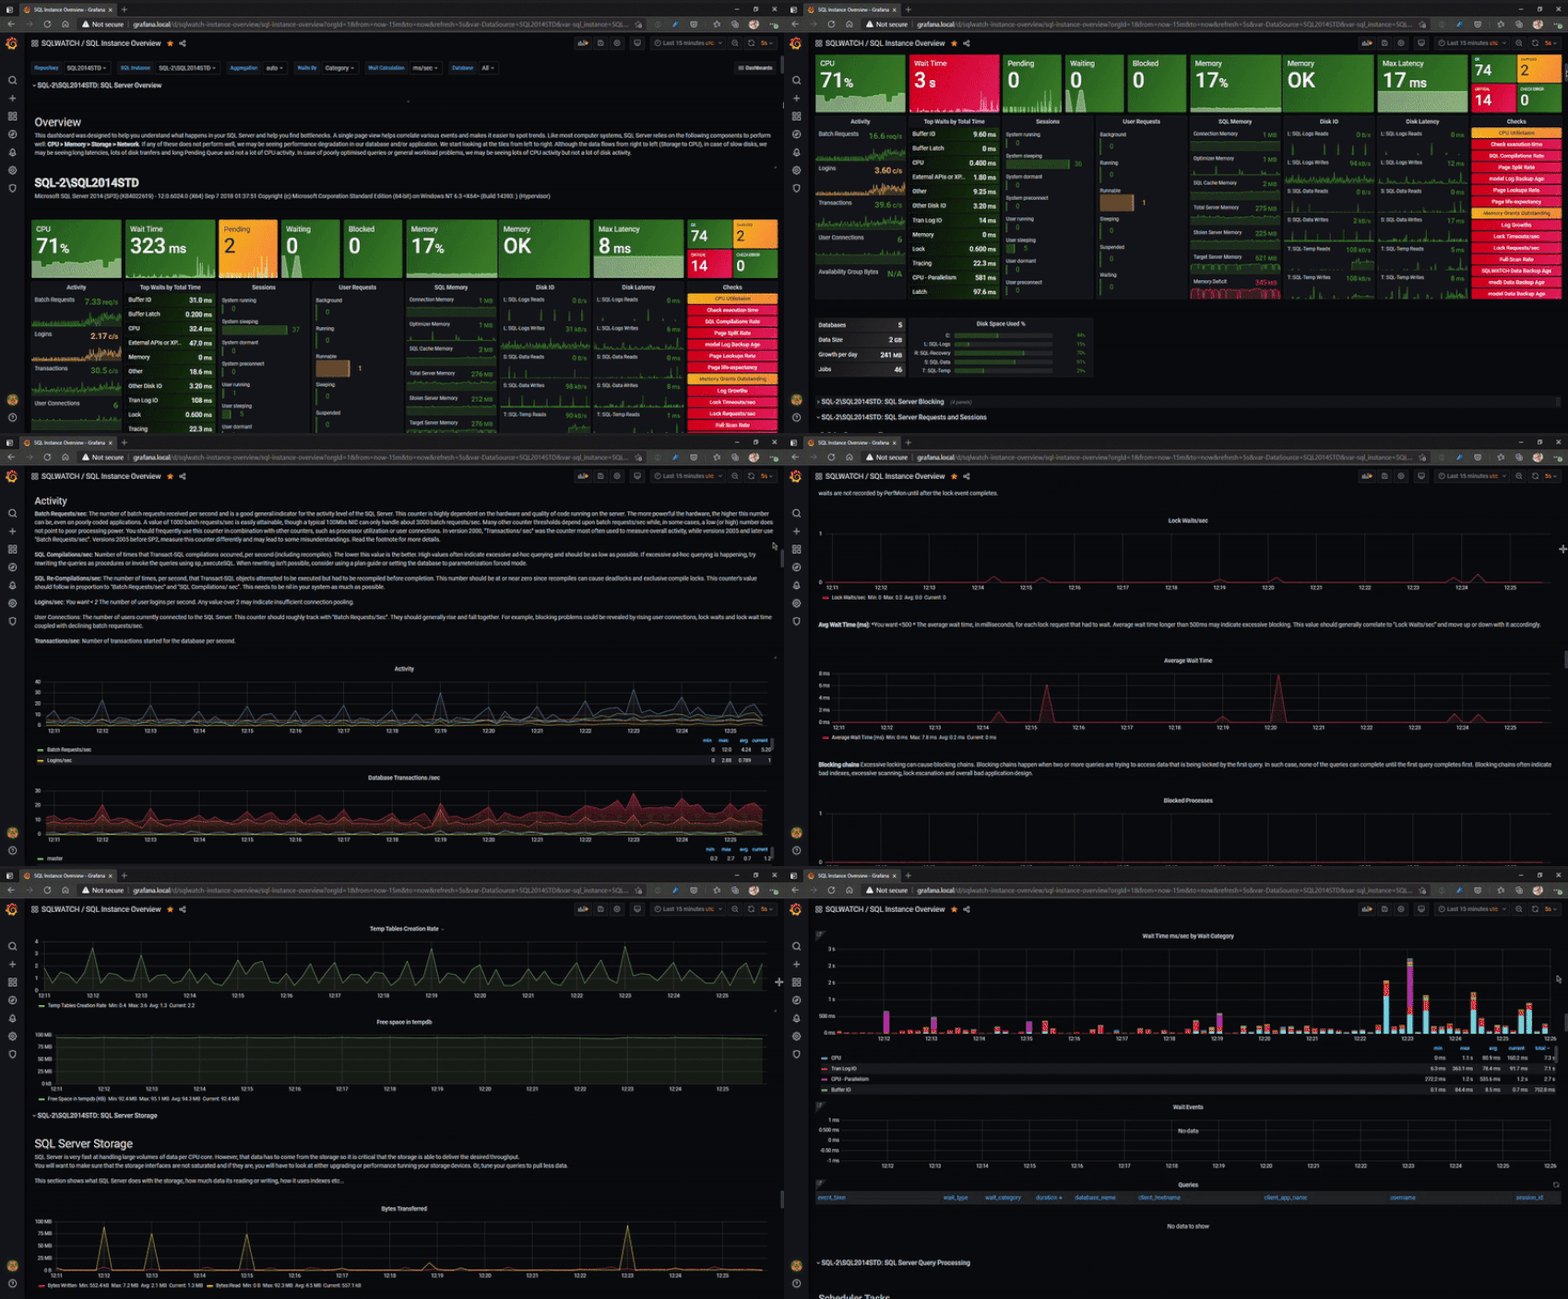
SQLWATCH is decentralised, real to near-real time SQL Server Monitoring Solution. It is designed to provide comprehensive monitoring out of the box and to serve as a monitoring framework for your own projects or applications. It collects performance data in a local database with an option for centralised reporting for convenience.
- 5 second granularity to capture spikes in your workload.
- Grafana for real-time dashboarding and Power BI for in depth analysis
- Minimal performance impact (around 1% on a single core SQL Instance when using broker for invocation).
- Out of the box collection with minimal configuration required to get it up and running.
- Extensive configuration available for your convenience.
- Zero maintenance. It has been designed to maintain itself.
- Unlimited scalability. As each instance monitors itself, you are not constrained by the capacity of the monitoring server.
- Works with all supported SQL Servers (with some limitations on 2008R2)
- How to get started https://sqlwatch.io/get
- Documentation https://docs.sqlwatch.io
- Our Slack channel for discussion, asking questions, solving problems https://sqlcommunity.slack.com/messages/CCCETQBFZ
SQLWATCH uses SQL Agent Jobs to trigger data collection on a schedule which write results to a local database. For that reason each monitored SQL Server instance must have SQLWATCH deployed, however, the destination database can be an existing "dbatools" database, msdb or a dedicated SQLWATCH database. For performance reasons, it is advisable to deploy into a dedicated database as we're setting Read Committed Snapshot Isolation which will not be done if deployed to an existing database. The data can be consumed and analysed by the Power BI report.
Tested on the following SQL Server versions:
- 2008 R2 SP3 (with some limitations)
- 2012
- 2014
- 2016
- 2017
- 2019
Although Docker and Linux work, the Windows-only WMI based disk utilisation collector will fail.
The easiest way to install SQLWATCH is to use dbatools:
Install-DbaSqlWatch -SqlInstance SQLSERVER1,SQLSERVER2,SQLSERVER3 -Database SQLWATCH
Alternatively, SQLWATCH can also be deployed manually from the included Dacpac either via command line using SqlPackage.exe:
SqlPackage.exe
   /Action:Publish
   /SourceFile:C:\Temp\SQLWATCH.dacpac
   /TargetDatabaseName:SQLWATCH
   /TargetServerName:YOURSQLSERVER
   /p:RegisterDataTierApplication=True
Or by deploying Data-Tier application in SQL Server Management Studio


